Grade 4 Graphing Project Rubric - Ontario
Ms Shannon Says
175 Followers
Description
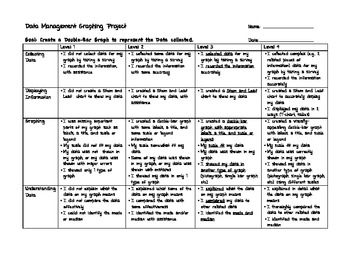
This is a rubric I created based on the Grade 4 Ontario Curriculum. It includes all specific expectations for Data Management related to graphing (not probability).
The preview is a sample that one student created. He left the bottom blank to print out a picture of LeBron!
I used this to assess a final data management project my class did. Each student had a bristol board and had to:
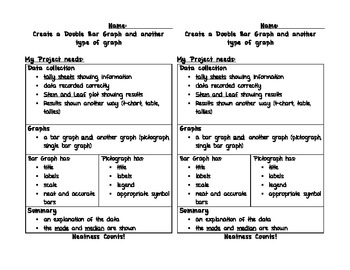
-collect data through a survey or experiment
-show their data in a tally chart, stem and leaf plot and t-chart
-create a double bar graph and 1 other kind of graph (bar graph, pictograph... line graphs are not introduced until grade 5, but who am I to stop them!)
-find the median and mode (if any)
-make conclusions based on their data (e.g., the most popular sport for boys, or, the data is equally spread out so all sports are equally popular, etc).
I've also included my student checklist, which prints 2 to a page. It has the expectations from the rubric turned into child-friendly language, so they are able to check what they have included in their work before finishing!
I really enjoyed this project, and I hope you will too!
Total Pages
2 pages
Answer Key
N/A
Teaching Duration
N/A
Report this resource to TPT
Reported resources will be reviewed by our team. Report this resource to let us know if this resource violates TPT’s content guidelines.


