249 results
Statistics projects for homeschool
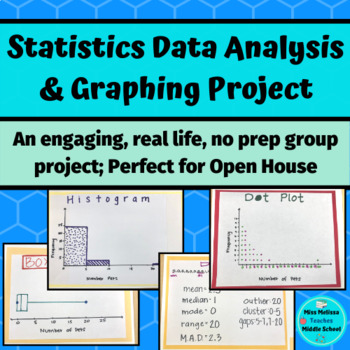
Statistics Project: Data Analysis & Graphing- real life, no prep
This statistics project is intended as a closure for your sixth grade statistics unit and aligns with ALL of the sixth grade statistics and probability common core state standards. In groups, students work together to choose a statistical question to ask the class. Once the class is surveyed, the group works together to create a frequency table, a dot plot, a histogram, and a box and whiskers plot. After creating their graphs, the groups analyze their data by looking at the mean, median, mode ra
Subjects:
Grades:
6th - 7th
Types:
Wiffleball -- Theoretical & Experimental Probability - 21st Century Math Project
Theoretical and Experimental Probability gets a 21st Century Math Project facelift in this interactive game. Tired of flipping coins and spinning spinners? Students play the role of team managers and with only player statistics they must build a team capable of winning the championship. Students will plays a series of Wiffleball games where they will keep track of statistics using a baseball/softball inspired scorebook and after the game crunch the number to see if their players performed up to
Subjects:
Grades:
6th - 12th
Types:
Also included in: Probability & Expected Value Unit Bundle - Distance Learning Compatible
Casino Royale -- Expected Value & Probability Game - 21st Century Math Project
Your students might be begging for for a day for them to play games. Let it be on your terms in this 21st Century Math Project! This Expected Value and Probability Project focuses on one of the more emphasized aspects of the Common Core Standards. Students will be asked to design their own games with defined expected value and host it in a Game Day event! The student that collects the most "Swagg Cash" will forever (or at least for 36 hours) be known as the Master of Swagg. ***THIS PRODUCT HAS B
Subjects:
Grades:
6th - 12th
Types:
CCSS:
Also included in: Probability & Expected Value Unit Bundle - Distance Learning Compatible
Math March Madness Full Tournament Project {BUNDLE}
Harness the excitement of NCAA March Madness with this huge project for secondary math teachers that follows all stages of the tournament! This Common Core aligned bundle comes with bonus parts not sold individually in my store so you can create a rich immersion in the tournament, practice probability and statistics and learn some interesting new ones along the way! Save $3 plus get bonus content by bundling!You can pick and choose which parts you would like to incorporate, or follow my schedu
Subjects:
Grades:
6th - 12th, Higher Education
Types:
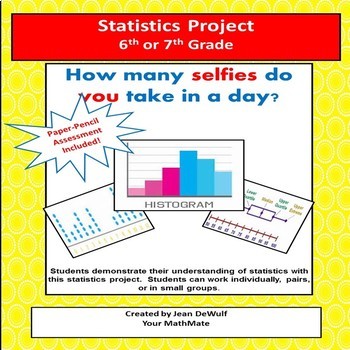
Statistics Project for 6th or 7th Grade! Bonus Assessment Included.
Your students are going to LOVE this interactive Statistics Project!You can choose either paper/pencil or digital formats for this project.Students can work individually, in pairs or in small groups.There are 5 parts to this project: Part I: Creating a Statistical Question Part II: Collecting Data & Determining the Measures of Center, Variation & 5 number summary. Part III: Creating 3 Graphs; a histogram, a dot plot and a box-n-whisker plot. Part IV: Written Description. Students will an
Subjects:
Grades:
6th - 7th
Types:
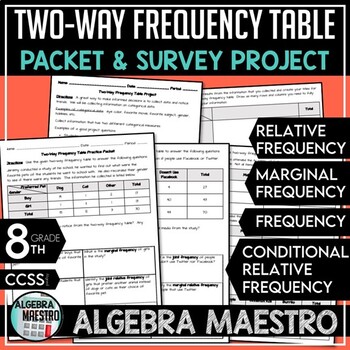
Two-Way Frequency Table Practice Packet & Project
With the Two-Way Frequency Table (or two way tables) Practice Packet & Project you'll receive:-3 pages of student practice via packet-3 pages of the answer key for the packet-2 pages for the student driven projectThe Two-Way Frequency Table Packet and Project are meant to be a review and reinforcement activity. Students can practice and further enhance their understanding using the Packet Practice. Teacher may want to further differentiate the content for advanced students and give them th
Subjects:
Grades:
7th - 12th, Higher Education, Adult Education
Types:
CCSS:
Medical Trial -- Statistics & T-Test - 21st Century Math Project
Bring your students into the world of double blind medical studies. Every day, doctors and hospitals rely on scientific studies and research to make healthcare decisions for patients. Are some medicines more effective than others? Do certain types of patients benefit more from certain types of treatments? Due to the security of medical records, studies are somewhat limited in their scope and are generally carried out at universities and research hospitals. At these facilities ground breaking wo
Subjects:
Grades:
8th - 12th
Types:
CCSS:
Correlation All-Star -- Sports Data Analysis - 21st Century Math Project
Bring an authentic sports-based math project to your Algebra, Algebra 2 or PreCalculus classroom with Lines of Best Fit and Correlations! All in this 21st Century Math Project! Using data from the MLB, NBA, NFL and NHL students investigate correlations to some of sports most common questions like: "Do more shots result in more goals?" "Do hitters or pitchers have more impact on a team's wins?""What NFL stat is most strongly correlated with wins?" and the grand-daddy..."Can money buy championship
Subjects:
Grades:
7th - 12th
Types:
CCSS:
Math Projects Middle School Bundle for STEAM
Jump into middle school math concepts with this Art meets math bundle of creative math projects. Great for math lab days or stations. 8 Math meets arts lessons + a bonus resource of linear equations with Calder ($45 VALUE). Each project includes:- Teacher's guidelines- Background information on artist- Student handouts for each part of the project- Answer key (where applicable)- Editable rubric (where applicable)- Slides or artwork related to projectThis bundle includes:- Rational vs. Irratio
Subjects:
Grades:
6th - 8th
Types:
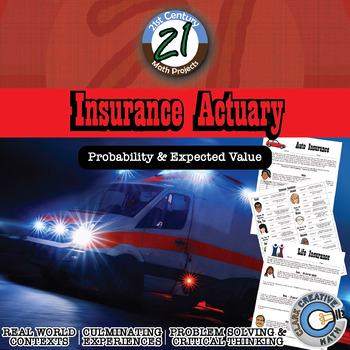
Insurance Actuary -- Expected Value - 21st Century Math Project
Insurance actuaries work hard to analyze risk and make premium recommendations for customers. There is a careful balance between finding an appropriate value based on the risk and creating profit for the insurance company. In this 21st Century Math Project, students where different hats as an actuary to understand insurance!This product includes 4 prep assignments that challenge students in expected value and insurance to build their skills and their thinking for the final project.In this 28 pag
Subjects:
Grades:
8th - 12th
Types:
CCSS:
Also included in: Probability & Expected Value Unit Bundle - Distance Learning Compatible
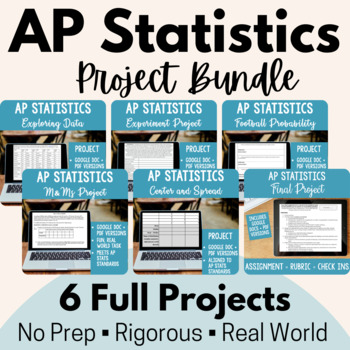
AP Statistics Project Bundle! 6 Projects + digital versions
Looking for some engaging, real-world projects to liven up your AP Statistics course? Need new materials that are ready for remote/ online learning? Want to make sure your AP Statistics course properly prepares student for the AP exam? Look no further - this bundle is for you! In this bundle, you will find four of my popular AP Statistics projects -- all updated to include EDITABLE google docs to assign to students as well as PDFs for printing, if you prefer. All projects also include a complete
Subjects:
Grades:
10th - 12th
Types:
Geometry: Survey and Circle Graph Project Made Fun!
Circle Graph Geometry Activity - Everyone just wants their piece of the pie!This is a fun, multi-faceted project that will have your students creating and implementing a survey, converting their results using various mathematical operations, and creating a poster-sized circle graph incorporating various geometry skills.This Survey and Circle Graph Project Unit Includes:PowerPoint:-Fun, interactive, 3-part PowerPoint slide presentation that walks you and your students through the entire project f
Subjects:
Grades:
5th - 7th
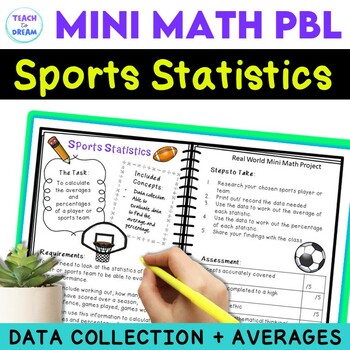
Inquiry Based Math Project | Data and Averages | Sports Statistics Grade 6th 7th
This Inquiry Based Math Project with the theme SPORTS STATISTICS, investigates percentages, averages and data. Students will be engaged and enjoy using numeracy in a real life situation. It has been designed for students in grades 4 to 7. Now suitable for in person and online learning with printable PDF and online Google slides.THE PERFECT WAY TO GET STUDENTS INTERESTED IN MATH!The projects are easy to follow and can either be teacher run or student driven. Each math project is designed to run b
Subjects:
Grades:
4th - 7th
Types:
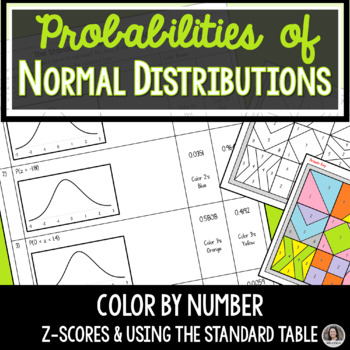
Probabilities of Normal Distribution, Z Scores Activity Project
Students shade the area under the normal distribution curve and determine the probabilities for the given z-scores in this color by number activity. Their answers will determine what color they will need to use to color the provided image. This self-checking activity allows students to work independently to practice their understanding of using The Standard Table to determine probabilities of normal distributions.The color by number activity can be assigned in a variety of ways. 1. Assign The S
Subjects:
Grades:
6th - 12th, Higher Education
Types:
Data and Graphs Projects, 5th and 6th Grade Math Enrichment
Fun Data and Graph Enrichment Projects Students Love! Nine fun math projects that range from finding distances from cities to Olympic records and even charting calories on a super sized cheeseburger. The fun and creative projects utilize line plots, line graphs, bar graphs, double bar graphs, pie/circle graphs, mode, median, mean and range. I've also included a set of vocabulary terms, sample graphs and and a rubric! Print and go math enrichment! Perfect for distance learning as well.Please che
Subjects:
Grades:
4th - 6th
Types:
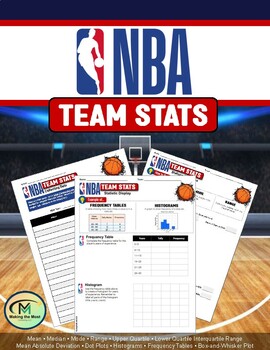
NBA Team Stats (Mean, Range, Median, Interquartile Range, Box Plots, Histograms)
This guided practice worksheet connects basic statistics with students' favorite NBA teams. Students are required to find the mean, range, median, and interquartile range (with box-and-whisker plot) of their favorite team's players' age, weight, and years in the NBA. Your students will love this engaging activity.
Subjects:
Grades:
6th - 12th
Types:
3-D Double Bar Graphs PROJECT from Student Generated Survey Data - Fun Project
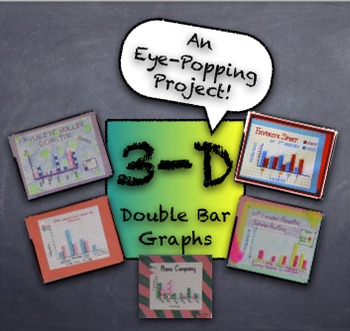
This project creates quite an impressive product with simple supplies easily accessible in any classroom. Students generate data from surveys given to peers, using simple questions like, "What's your favorite pizza topping?" Students use survey results to create a 3-dimensional "girls versus boys" double-bar graph. Using centimeter graph paper, markers, and glue sticks, the double-bar graph projects are truly eye-popping! Project description, survey information, and graph assembly instructio
Subjects:
Grades:
3rd - 12th, Adult Education
Types:
AP Statistics M&M Sampling Distribution Project - Works for Distance Learning!
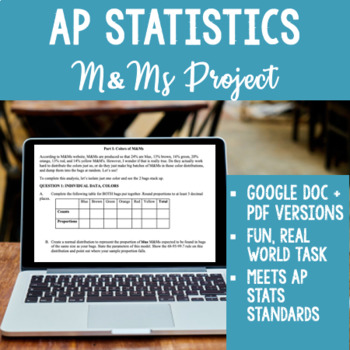
NEW for 2020! This resource now includes both a PDF for printing out a physical copy AND a fully editable Google Doc link for remote or distance learning! Assign the Google doc to your students, and they can type their answers directly into the document and submit their work digitally. They can also create normal curve diagrams in Google Docs using Insert-Image (kids figure out how to do this quite quickly, as I learned this year!)I use this project every year in my AP Statistics class to demyst
Subjects:
Grades:
10th - 12th
Types:
Also included in: AP Statistics Project Bundle! 6 Projects + digital versions
Gridiron Glory -- "Big Game" Data & Paper Football - 21st Century Math Project
I have heard that Americans like Football. I have also heard about an important game that happens in February. I have heard that it's a day that nachos dread. In this 21st Century Math Project, students will complete a variety Football-based assignments related to the Statistics strands of the Common Core. The project caps off with a Paper Football tournament that asks students to use expected value to guide their decisions!This product includes 3 prep assignments that reaches a variety of learn
Subjects:
Grades:
6th - 12th
Types:
CCSS:
Also included in: Probability & Expected Value Unit Bundle - Distance Learning Compatible
Probability & Statistics in Baseball Project (Common Core Aligned, AND FUN!)
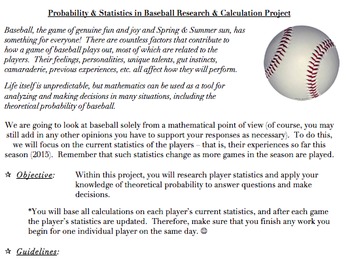
The problems and activities within this document are designed to assist students in achieving the following standards: 6.SP.B.5, 7.SP.C, HSS.CP.A.2, HSS.CP.A.3, HSS.CP.B.7, HSS.CP.B.9, as well as the standards for mathematics practice and the literacy standards. They are also designed to help the teacher assess the students’ abilities when it comes to working with the ideas within the standards.This document contains the following:A project designed to allow students to investigate theoretical
Subjects:
Grades:
5th - 12th, Higher Education, Adult Education, Staff
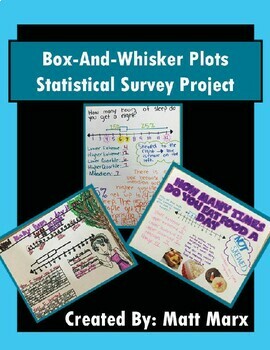
Box And Whisker Plots - Statistical Survey Project
Box-And-Whisker Plots - Statistical Survey ProjectThis Statistical Survey Project offers students the opportunity to demonstrate an understanding of Statistics content through the lens of a personalized statistical survey and the creation/study of a Box-And-Whisker Plot.Students insert themselves into their learning by selecting their own personalized survey question. Students have fun creating their posters, sharing them with the class, and having them displayed for all to see in the classroom.
Subjects:
Grades:
6th - 12th, Higher Education, Adult Education
Types:
CCSS:
Project-Based Learning, PBL | High School Math (Statistics)
Spark Curiosity and Ignite Future Scientists with Award-Winning Project-Based Learning (PBL) in Statistics!Are you an educator, homeschool parent, or student looking for engaging, real-world PBL experiences that go beyond the typical "science fair volcano"? Look no further than the Scienovate Science Fair Projects Bundle for High School!This comprehensive bundle throws away the tired, superficial activities and dives headfirst into the powerful application of Statistics in solving critical chall
Subjects:
Grades:
9th - 12th, Higher Education, Adult Education
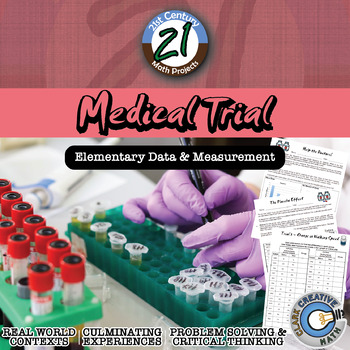
Medical Trial -- Elementary Data Edition - Medical - 21st Century Math Project
Bring your students into the world of double blind medical studies. Every day, doctors and hospitals rely on scientific studies and research to make healthcare decisions for patients. Are some medicines more effective than others? Do certain types of patients benefit more from certain types of treatments? Due to the security of medical records, studies are somewhat limited in their scope and are generally carried out at universities and research hospitals. At these facilities ground breaking wo
Subjects:
Grades:
3rd - 5th
Types:
Spring into Statistics Data Displays and Measures of Center Lab
This is a hands-on lab that teaches about Statistical Questions, Data Displays (dot/line plot, histograms, box plots) and Measures of Center (mean, median, mode, and range). The lab includes notes pages, examples with answer keys, and a final project in which the student can survey classmates and create a "flower" by using their data to find mean, median, mode, range. They will also create a box plot, histogram and dot plot.
Showing 1-24 of 249 results


