Wiffleball -- Theoretical & Experimental Probability - 21st Century Math Project
- PDF
What educators are saying
Also included in
- This is a selection of my Probability & Expected Value resources all in a money saving Essential Bundle! You save significant money and time versus purchasing these separately!Essential Bundles are designed to give you everything you need to rock your unit. Warmups, Notes, Activities, Games, ExiPrice $28.00Original Price $87.00Save $59.00
- The project is the core of what I have built my classroom around. Scaffolding learners to real world projects. This bundle includes the 105+ math projects I have written. This is over 2,700 pages of content.21st Century Math Projects each scaffold through an authentic context and math skill buildingPrice $316.00Original Price $564.00Save $248.00
- 12 of my best selling projects/units all in an organized money saving bundle! These engaging, student/teacher approved math projects that provide rigor, relevance, and cross-curricular content altogether. Check out the preview to see the alignment to 6-8 grade Common Core Standards! I have eachPrice $36.00Original Price $67.00Save $31.00
Description
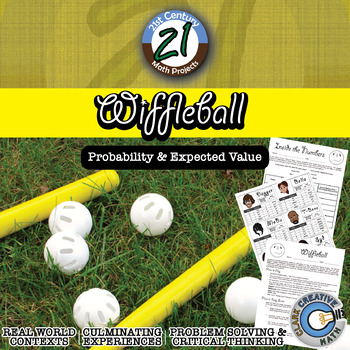
Theoretical and Experimental Probability gets a 21st Century Math Project facelift in this interactive game. Tired of flipping coins and spinning spinners? Students play the role of team managers and with only player statistics they must build a team capable of winning the championship.
Students will plays a series of Wiffleball games where they will keep track of statistics using a baseball/softball inspired scorebook and after the game crunch the number to see if their players performed up to their theoretical expectations. How does experimental probability match up? Students will find out together.
And your class can crown a champion if you choose to use the tourney bracket (included!)
In this 11 page document you will be given a mapping to the Content Standards, an outline for how to implement the project, a rules handout, the Scorebook, Player Cards, handouts for before and after the games and an 8-team championship bracket.
-- In "Pre-Game", students will choose a team of players and complete an assignment asking them to make predictions such as what the theoretical batting average of their team will be.
-- In "Wiffleball", students will faceoff against an opponent, draft a team, keep track of their statistics and see if they can win the championship!
-- In "Inside the Numbers", students will complete an analysis of theoretical vs. actual probability. Students will evaluate which players performed above or below expectations from the perspective of a team manager.
Dice not included.
Since this projects is driven by the student's individual choices and results, an answer key is not applicable.
You may be interested in the following discounted bundles. SAVE $$$!
•21st Century Math Projects -- All the Projects
•Pre-Algebra Projects Starter Bundle
Need an Entire Curriculum?
•21st Century Pre-Algebra –- the Entire Curriculum
For more tips, tricks and ideas check out the Clark Creative Education Blog
And join our community where I post ideas, anecdotes, elaborations & every once in a while I pass out TPT gift cards! And jokes! I do jokes too!


