378 results
Graphing projects for homeschool
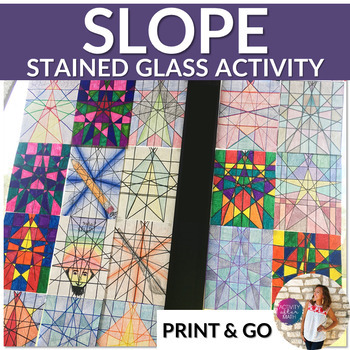
Stained Glass Slope Graphing Linear Equations Slope Intercept Form
Students will graph 18 equations written in slope-intercept form. All four types of slope are included(positive, negative, undefined, and zero). They will then darken the lines and color however they like creating a picture with a stained glass effect. This is a great activity that goes beyond the worksheet! You can save paper by printing the instructions on one side and the graph paper on the other!This resource includes:Student instructions pageGraph paper with the numbers and x- and y-axis la
Grades:
8th - 9th
Types:
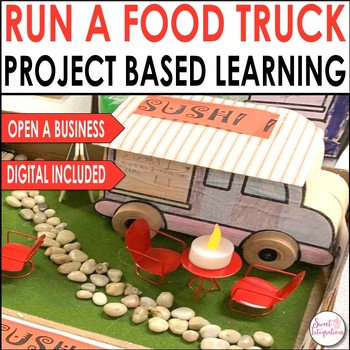
Design and Run a Food Truck STEM With Digital PBL - Project Based Learning Math
Introduce your students to the FOOD TRUCK CRAZE as they master their math and STEM skills through this project based learning math unit. With this math project based learning unit, students will design and run their own food truck! As they plan their final product in this PBL unit, students integrate digital learning by investigating various cultures and diversity and learning about foods from different countries. They will be able to represent a country of their choice, design (STEM) open a fo
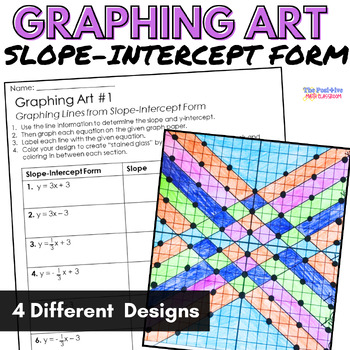
Slope Intercept Form Graphing Activity
Not only will this math art activity help your students practice writing and graphing equations in slope intercept form, but it will also add beautiful stained glass-styled art to your classroom! Best of all, this product includes 4 different options to help you differentiate within your math classroom and can be used for sub plans, extra credit, review, and more! Click here to save money when you purchase this product included in the Graphing Equations Art Bundle After graphing each set of lin
Grades:
7th - 9th
Types:
Also included in: Graphing Linear Equations Art Bundle
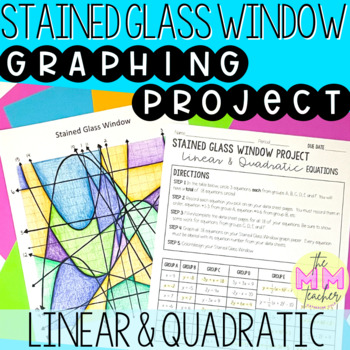
Graphing Linear & Quadratic Equations: Stained Glass Window Project
Stained Glass Window Project: Graphing Linear & Quadratic EquationsThis resource is meant to be used AFTER students have been taught about linear equations AND VERTEX FORM of quadratic equations. I have used this project as an end of the year activity for both Algebra 1 and Geometry. It allows Algebra 1 students to apply standards they have learned throughout the year and it gives Geometry students a chance to refresh their Algebra 1 skills before taking Algebra 2.Students will choose a tota
Grades:
8th - 10th
Types:
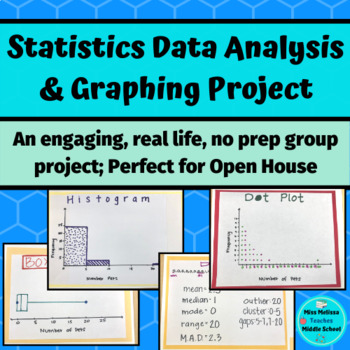
Statistics Project: Data Analysis & Graphing- real life, no prep
This statistics project is intended as a closure for your sixth grade statistics unit and aligns with ALL of the sixth grade statistics and probability common core state standards. In groups, students work together to choose a statistical question to ask the class. Once the class is surveyed, the group works together to create a frequency table, a dot plot, a histogram, and a box and whiskers plot. After creating their graphs, the groups analyze their data by looking at the mean, median, mode ra
Subjects:
Grades:
6th - 7th
Types:
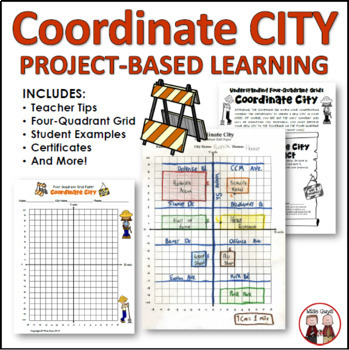
End of Year Math Coordinates City Project
Are you looking for an engaging end of year activity to teach coordinates to your upper elementary and middle school math students? Your upper elementary and middle school students will become engaged as they are asked to design a city based on using a coordinate plane. This is a teacher-friendly resource and minimal prep is involved.This resource contains 9 total documents (12 pages total) that are intended to be a creative math lesson plan that has students create their own city using coordina
Subjects:
Grades:
4th - 6th
Types:
Earth Day Math Project for Graphing and Data Interpretation
This resource is included in PDF format for printing and in Google Slides™️ format for digital learning. This makes it useable with Google Classroom™️.Are you looking for a way to reinforce graphing and data interpretation concepts in an engaging way that helps your students make connections? “Our Earth” is a real-life math project where students will complete eleven different graphing and data-related tasks. These activities can be used as a package, or in isolation. They work great as a math c
Subjects:
Grades:
2nd - 3rd
Also included in: Math Projects & Escape Rooms for Grades 2-3 | Bundle of Ten
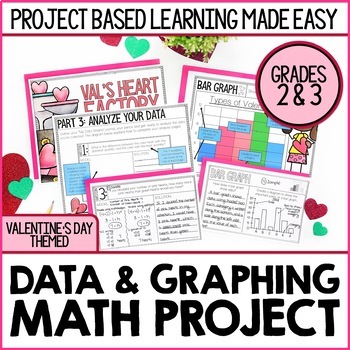
Valentine's Day Math Project | Conversation Hearts Graphing Lesson & Activity
This Valentine's Day-themed math project introduces your students to four methods for displaying data: Frequency TablesBar GraphsPictographsLine Plots Your students will record observations about each method for displaying data and compare/contrast methods for collecting data. Students will then use this knowledge to solve a problem for Val’s Heart Factory. Love this project idea, but planning to teach graphing at a different time of year? Sal's Sweet Factory will be a perfect fit for your class
Subjects:
Grades:
2nd - 3rd
Types:
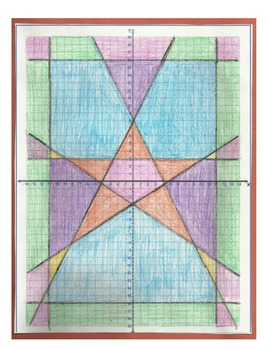
Graphing Linear Equations Quilt Project
Graphing Linear Equations Quilt ProjectI have created this project as a fun way to get my kids excited about graphing lines. I have always found that including art and coloring with math gets kids a bit more excited about learning and as an added bonus- they look great as classroom decorations when finished! These quilts focus on accuracy when graphing diagonal lines along with vertical and horizontal lines.This is a 100 point project that includes: directions for the students, a sheet for the s
Grades:
8th - 11th, Adult Education
Types:
Second Grade Social Studies-Common Core Economics Unit
This is an economics unit for second grade that is aligned with Second Grade Common Core Social Studies Standard E.1.1-1.6. This unit includes almost everything you need to teach this standard. There are lesson plans for you, a student book, a study guide, a test, a take home project with a parent letter, a wallet and money and a classroom game. This is a 10 day unit.
Subjects:
Grades:
2nd - 3rd
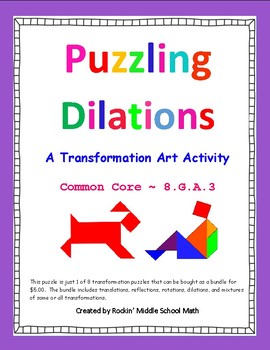
Dilations puzzle - Transformation Art activity - CCSS 8.G.A.3
This is a high interest, interactive activity that will allow you to easily see if your students have mastered dilations on a coordinate plane. Students must use the given pre-image points, perform the stated dilations, and then plot the new image points to create a figure which they can then color and decorate. This can be used as an in class or home project or an assessment. Common Core 8.G.A.3 - Describe the effect of dilations, translations, rotations, and reflections on two-dimensional figu
Grades:
7th - 10th
Types:
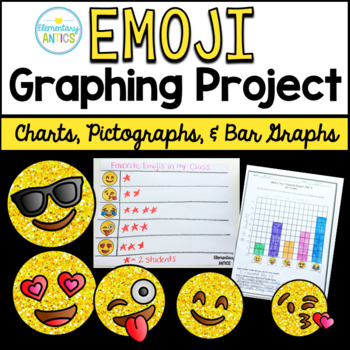
Emoji Graphs and Data Project {Charts, Pictographs, Bar Graphs}
This fun graphing project is a great way to introduce your students to collecting data and graphing- and the emojis keep them engaged and excited about learning!The Emoji Graphing Project includes 3 days of lesson plans!Part One: Conducting the SurveyPart Two: Making a Picture GraphPart Three: Create a Bar GraphAdditional Graphing Practice (3 more worksheets)Simple lesson plans are included for each part, but there is a ton of flexibility on how you can use this project in your classroom since y
Subjects:
Grades:
2nd - 3rd
Types:
Measurement Math Project for Distance, Time, Money, Graphing
This resource is included in PDF format for printing and in Google Slides™️ format for digital learning. This makes it useable with Google Classroom™️.Are you looking for a way to reinforce measurement concepts in an engaging way that helps your students make connections? “The Road Trip” is a real-life math project where students will complete eleven different measurement-related tasks. Please note that both metric and imperial versions are included!Take a look at what you’ll find inside this ma
Subjects:
Grades:
4th - 5th
Also included in: Real Life Math Projects and Escape Rooms (4-5): Bundle of Ten
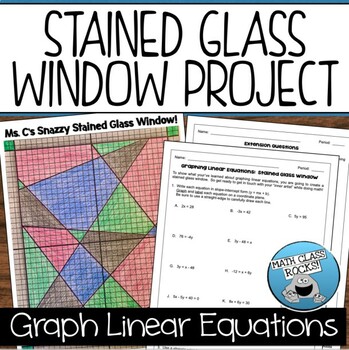
GRAPHING LINEAR EQUATIONS - STAINED GLASS WINDOW PROJECT
Graphing Linear Equations Stained Glass WindowUse this fun and engaging activity to assess your students’ ability to demonstrate some of the things they’ve learned about graphing linear equations! Students will graph a set of 12 linear equations to create a stained glass window. Choose one of two versions - one in which the equations are already in slope-intercept form and one that requires the students to solve equations for y before graphing! Either way, this activity allows each student to ge
Grades:
7th - 9th
Types:
Also included in: LINEAR EQUATIONS SYSTEMS OF EQUATIONS BUNDLE
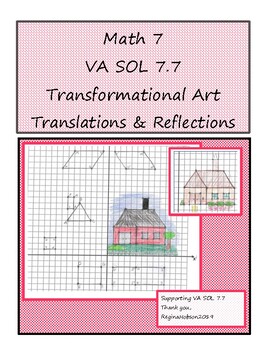
Virginia VA SOL 7.7 Transformation Art Project: Translations and Reflections
This PBA (Performance Based Assessment) supports VA SOL 7.7. Students will perform translations and/or reflections of quadrilaterals or triangles to create a simple "self checking" picture. The project is designed to use at the end of a my Unit 9 on Transformations as review before the unit test. My students love to draw, so anytime I can incorporate drawing into my lessons, they really perform well. I could hear a pin drop during this activity and the end results produced a really cute bull
Grades:
6th - 8th
Types:
Dilations Initials Project - Project Based Learning with Digital Easel Activity
Dilations Initials Project.This is a culminating project for a unit on dilations. Students enlarge and shrink a drawing of their initials on grid paper or poster-board and use coordinate graphing rules to produce a similar image. In addition, they enlarge the image and it must have a scale factor of at least 4. Then they shrink the image and it must have a scale factor of at most 1/4. Good activity for project-based learning. Digital and Print: Includes an Easel Activity ready for learning with
Subjects:
Grades:
6th - 9th
Types:
Fun with Slope: Rate of Change Activities Bundle – Project Based Learning (PLB)
The purpose of the Rate of Change Activities Bundle is to give students the opportunity to use creativity to analyze, graph, and solve rate of change problems in real-world settings. This bundle includes three unique tasks: First Car Mastery Task, i-Logo Slope Mastery Project, and the Raising Puppies Mastery Task. These activities and their accompanying materials are suited for students in grades 7 - 9. The following downloads are included: 1. First Car a. Teacher Instructionsb. Student Workshee
Subjects:
Grades:
7th - 9th
Types:
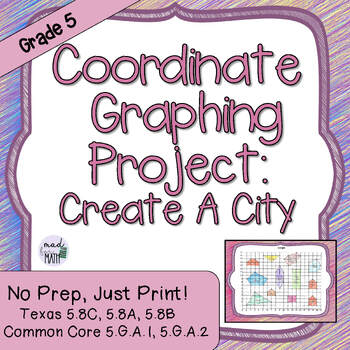
5th Coordinate Graphing Project Create a City 5.8C 5.8A 5.8B 5.G.A.1 5.G.A.2
Perfect independent project or math center for your fifth graders that integrates coordinate graphing and geometry!!!This product is also part of a Coordinate Graphing BUNDLE found hereStudents will use the coordinate plane to create a city with various landmarks which will form 2D shapes. Students will name and label the landmarks on the worksheet provided. They will also name all of the vertices of each landmark with their given coordinates.Once they have created their city they will practice
Grades:
4th - 6th
Types:
Also included in: 5th Grade Coordinate Graphing BUNDLE! Task cards vocabulary project
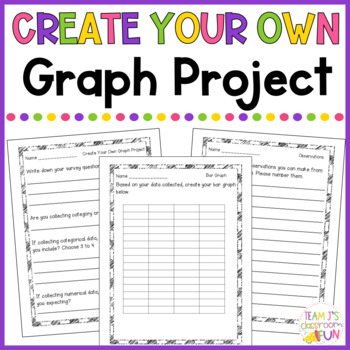
Graphing Project | Bar Graphs, Line Plot, Picture Graphs| Data Analysis Activity
Wrapping up your graphing unit is easy and fun with this project! This engaging activity provides students with a chance to apply their graphing skills, vocabulary, and knowledge to this final project. This no prep resource is easy to use - just print and go!Included in this resource:Teacher DirectionsPlanning PagesData Collection PageChecklistGraphing Pages (bar graph, pictograph, and line plots options)Observations Page Here are a few ways you can use this resource:• Independent Project• Pa
Subjects:
Grades:
1st - 3rd
Types:
CCSS:
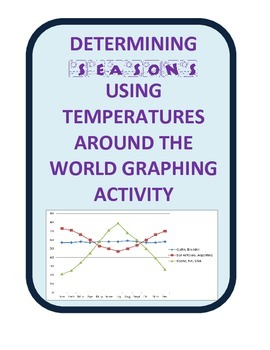
Graph World Temperatures to Understand Seasons and Earth's Tilt
Students analyze temperature data to discover the pattern of temperature change from the summer to winter in the Northern and Southern Hemispheres and the Equator. Students first find locations using longitude ad latitude, then graph temperatures to show seasonal differences around the world. Students then answer questions and look at a diagram of the earth's tilt to understand seasons.
FUN- and VERY ENGAGING! Helps students 'get it'!
Seasons Labs and Station Science!
Understanding Seasons
Subjects:
Grades:
5th - 9th
Types:
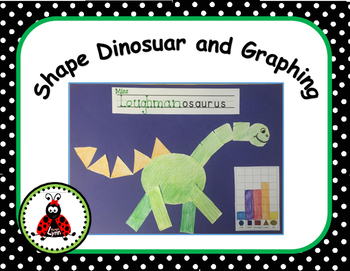
Shape Dinosaur and Graph
Students will think this project is DINO-MITE! This was by far one of my students' favorites this year. Students will get to cut out shapes, color and create a dinosaur of their choice. They will then use the provided graph to graph how many of each shape they used to create their dinosaur.
This packet includes:
*Student examples
*Two pages of shapes to cut out
*Shape graph
*______osaurus for name title
This project helps them with the following skills:
*Cutting
*Shape identification
*Grap
The Great Graphing Project
This is a printable project activity for your students to complete after they are finished studying about Graphs. It includes 11 pages:
Page 1 - Student Instructional Sheet
Page 2 - Survey
Page 3 - Frequency Table Template
Page 4 - Line Plot Template
Page 5 - Pictograph Template
Page 6 - Bar Graph Template
Page 7 - Circle (Pie) Graph Template
Page 8 - Line Graph Template
Page 9 - Stem and Leaf Plot Template
Page 10 - Histogram Template
Page 11 - Grading Rubric
I put all these pages together in
Grades:
3rd - 9th
Types:

Rockets with STEM and Straws
STEM SWOOSH! : Soda Straw Rocketry with Aeronautical EngineeringDo you have straws, pencil, paper, scissors, and an hour? Add our lesson and you have an easy STEM activity for your class. Perfect for the hallway on a rainy day or outside when the sun cooperates. You can even integrate it into a math lesson by having the kids measure the distance flown. Or use it to teach scientific variables by changing the length of the straw or size or location of the fins. Need a graphing assignment? this pro
Subjects:
Grades:
2nd - 6th
Types:
NGSS:
3-5-ETS1-3
, 3-5-ETS1-1
, 3-5-ETS1-2
Also included in: STEM Activities | Fifty Lessons Mega Bundle
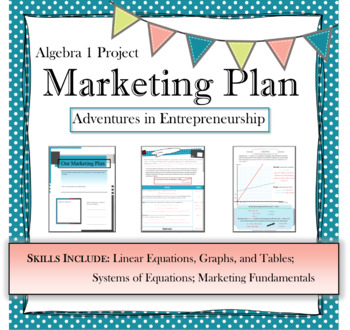
Algebra Marketing Plan PBL | project based learning | real world Math
This Project Based Learning activity will help Algebra 1 students practice setting up and solving systems of linear equations within a real world context. As they take on the role of an entrepreneur, they will write equations, plot coordinate points, graph equations, analyze data, and draw conclusions. This can be used as a group project or individual project and would work great for an end of unit review. ------------------------------------------------------------------------------------------
Subjects:
Grades:
7th - 12th
CCSS:
Also included in: Math Algebra 1 BUNDLE projects, activities, notes, and more
Showing 1-24 of 378 results


