29 results
Statistics Common Core 3.MD.B.3 printables
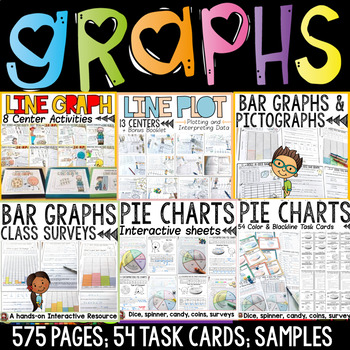
Bar Graphs Pictographs Line Graphs Line Plots Pie Charts Data Collection Bundle
The graphing bundle features interactive activities for creating and interpreting bar graphs, pictographs, line graphs, line plots and pie charts. Your entire graphing unit for a year!Separate folders featuring both British English and US spellings and terminology included.Great quality and value for this whopping 575 + page unit on graphing! Data is collected and interpreted using concrete materials such as visuals, dice, spinners, coins and other real-life objects and contexts. Further details
Subjects:
Grades:
2nd - 6th
Types:
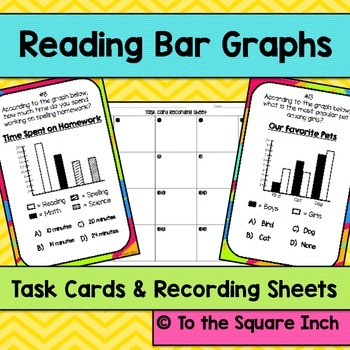
Bar Graphs Task Cards | Math Center Practice Activity
Reading Bar Graphs Task Cards and Record Sheets CCS: 2.MD.10, 3.MD.3
Included in this product:
*20 unique task cards dealing with reading and interpreting bar graphs with different scales (2 per page)
*4 different recording sheets
*Answer Key
Check out addition statistics products HERE
Subjects:
Grades:
2nd - 5th
Types:
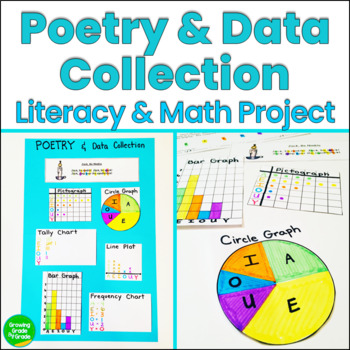
Graphing and Data Project
Kids will have a blast integrating literacy, data, and graphing by using "real-life" data! Students will also enjoy various poems and nursery rhymes while they practice collecting and displaying the number of vowels used in a poem. Poems are included!Kids read a short poem, count all the vowels, then display them on different graphs and charts. Sample images are included. Poems are included as well as suggestions for other great poems. The project is extended with questions for discussion and/or
Subjects:
Grades:
4th - 6th
Types:
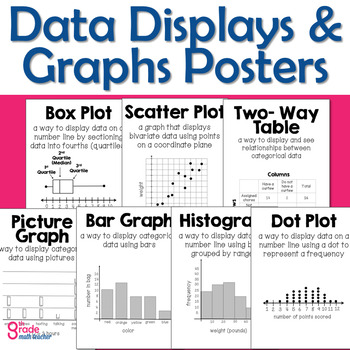
Types of Graphs and Data Displays Posters
Need visuals for your statistics unit? These 7 printable posters show definitions and examples for students of vocabulary they can reference as they learn. They are simple, easy to read, and informative. It's math classroom décor with an important purpose!Hang these posters as part of your word wall all year or when you teach your statistics unit. They are the perfect visual aids and have information students need.Make them colorful! The posters are black and white and can be printed on any colo
Subjects:
Grades:
3rd - 8th
Types:
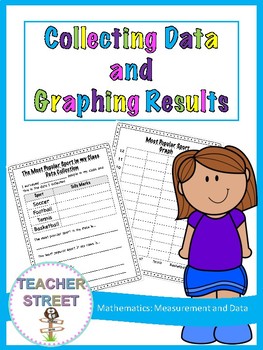
Collecting Data and Graphing Results
Have your students work through the process of collecting, representing and analyzing data.
This pack includes templates for the following topics;
Most Common Pet
Most Popular Sport
Favourite Fruit
Most Popular Book
Favourite Subject
Favourite Shape
Number of Siblings
+ a blank template for students to choose their own topic.
You might like your students to complete all the topics or simply allow them to choose a couple they are interested in.
Each graph comes in two versions.
Numbered up t
Subjects:
Grades:
1st - 3rd
Types:
Roll, Tally, Graph - a data game for Math {Common Core Aligned}
This fun game can be played by your students either alone or in a small group and will help them put into practice what they know about tally marks, as well as giving them the opportunity to create a graph using real data they have collected.
Your PDF download includes a high-quality, full-colour die template for you to print, a student instruction page that you could use for a Mathematics Station, a tally sheet for students to collect data (this could be laminated and written on using a dry-er
Subjects:
Grades:
1st - 4th
Types:
Data Analysis & Probability - Task & Drill Sheets Gr. 3-5 - Distance Learning
Create graphs using gathered information and accurately read the data to make predictions. Our resource introduces the mathematical concepts taken from real-life experiences, and provides warm-up and timed practice questions to strengthen procedural proficiency skills. The task and drill sheets provide a leveled approach to learning, starting with grade 3 and increasing in difficulty to grade 5.About this Resource:Create circle graphs to match the fractions. Survey your class to find out what p
Subjects:
Grades:
3rd - 5th
Types:
Data Analysis Game - Small Group TableTop Practice Activity
Bring the TableTop Game revolution to your classroom! Board games are experiencing a renaissance and tapping into their innate engagement is a no brainer. This is the natural evolution of task cards. TableTop Math games cover a single unit of math study. The questions range from simple skill practice to application. Provided are four different game styles that can be played with the same set of math cards. Mix it up or let your students choose what to play. The choice is yours! In Journey, stude
Subjects:
Grades:
6th - 10th
Types:
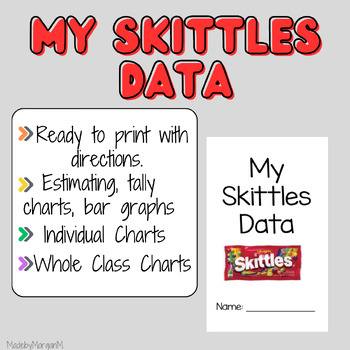
Skittles Data Collecting
Skittles data collection! Use this in your classroom and get each kid a small pack of skittles and they can collect statistics and probability about their pack. Then they will create their own graph before putting the numbers all together to make a class graph! Students love doing this and getting a fun treat in the end. More example pictures coming soon.If you would like to see this product with other types of candy please feel free to send me a message and I would be happy to create it! Please
Subjects:
Grades:
2nd - 5th
Types:
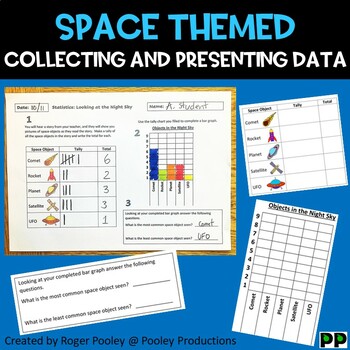
Space themed Collecting and Presenting Data Grades 1-3 No Prep
This resource is a Statistics recording worksheet in which student collect and present data.Once printed this resource is ready to go at any time.The students are provided with a recording sheet. The teacher reads out a short story or script and the students record data from the story (as it is read) on to their sheet. The story is about looking at the night sky. Students then collate and display the data before answering a couple of comprehension questions.Students end up with an excellent wor
Subjects:
Grades:
1st - 3rd
Types:
CCSS:
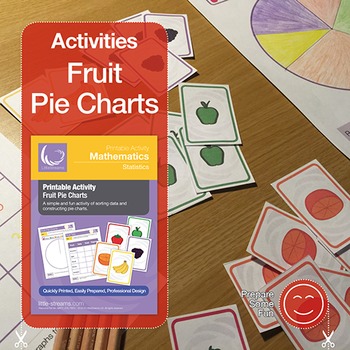
Fruit Pie Charts Activity
This activity offers a different way to teach tally and pie charts. Students choose 20 fruit cards from the fruit deck (or any amount you choose from the 45 cards if you wish to make things more challenging). We recommend that 20 cards offers the most interesting collection to work with, while also being a factor of 360. Students collect the data of their chosen cards and write it on the tally sheet. On the same sheet is a column for working out the number of degrees needed for constructing the
Subjects:
Grades:
2nd - 4th
Types:
Data Analysis & Probability - Drill Sheets Gr. 3-5
Get a handle on probability and predict what the most likely scenario will be. Our resource provides warm-up and timed drill activities to practice procedural proficiency skills. The drill sheets provide a leveled approach to learning, starting with grade 3 and increasing in difficulty to grade 5.About this Resource:Find out how many more birthdays are in December than in November using a pictograph. Determine whether a statement is likely, unlikely, certain, or impossible to happen. Find the p
Subjects:
Grades:
3rd - 5th
Types:
Also included in: Five Strands of Math - Drills BIG BOOK - BUNDLE Gr. 3-5

Texas Independence Day themed Collecting and Presenting Data Grades 1-3 No Prep
This resource is a Statistics recording worksheet in which student collect and present data.Once printed this resource is ready to go at any time.The students are provided with a recording sheet. The teacher reads out a short story or script and the students record data from the story (as it is read) on to their sheet. The story is about icons for a t-shirt design. Students then collate and display the data before answering a couple of comprehension questions.Students end up with an excellent w
Subjects:
Grades:
1st - 3rd
Types:
CCSS:
Also included in: Texas Independence Day Theme Activities Grades 1-3
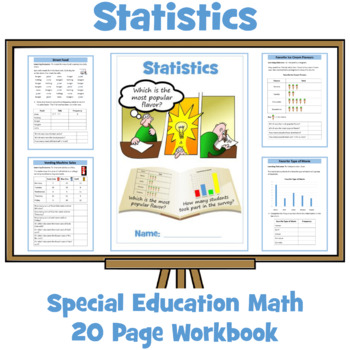
Statistics Workbook - Special Education Math
This math resource has been designed for older Special Education students working at grades 1-2. It contains an age-appropriate, 20-page workbook (20 worksheets) with progress check, certificate of achievement on statistics. Tasks and activities have been designed to achieve the following outcomes:Sort and classify objects using more than one criterionCollect information by surveyRecord results in lists, tally charts, and tablesConstruct and interpret pictograms where one picture represents one
Subjects:
Grades:
Not Grade Specific
Types:
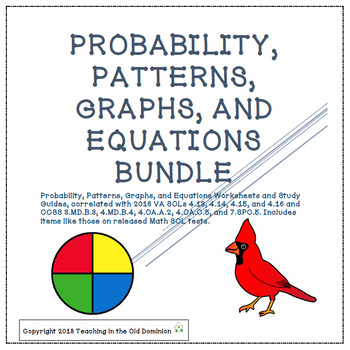
Probability, Patterns, Graphs, and Equations Mini-unit BUNDLE
Probability and Patterns Worksheets and Study Guide including determining the likelihood of an event, representing probability as a number, creating models or practical problems to represent probability, and patterns found in objects, pictures, numbers, and tables. Correlated with 2016 VA SOL 4.13 and 4.15 and CCSS 4.OA.C.5 and 7.SPC.5. The calculator symbol indicates that the problems in this unit will appear on the section of the Grade 4 Virginia SOL Math test that allows a calculator. I
Subjects:
Grades:
3rd - 7th
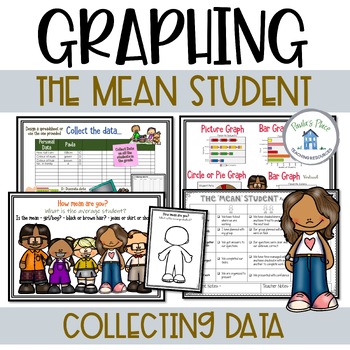
Graphing the Mean | Your Mean Student - Project Based Learning
Graphing the Mean - Your students will experience a math task that will lead to a group presentation. They will compose questions, collect data, collate data, determine the ‘mean’, show the data in various graphs and design a poster to present the ‘mean student’.Slides include-What the unit will cover-How mean are you? What will you be looking for?-What is the mean?-How mean are you?-Template for recording the mean student-Ideas for recording data-Group guidelines – it’s your turn-Types of graph
Subjects:
Grades:
4th - 6th
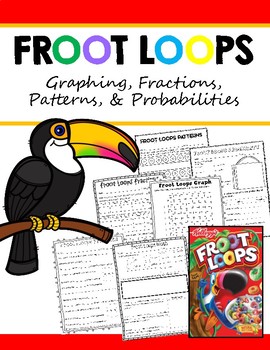
Froot Loops Packet
Included are worksheets about: Common Core reference sheet Froot Loops bar graph Froot Loop fractions {2 pages: one with scaffolding about how to label and figure out fractions, fractions, and equivalent fractions} Froot Loop Patterns Froot Loops Probability Froot Loops MathPlease follow me at, Teaching Curious Kids Also, follow Teaching Curious Kids on Facebook for exclusive giveaways and freebies! Also check out some of my other math resources:Expanding Math Reference Sheet Bu
Subjects:
Grades:
2nd - 3rd
Types:
Also included in: Edible Math Bundle
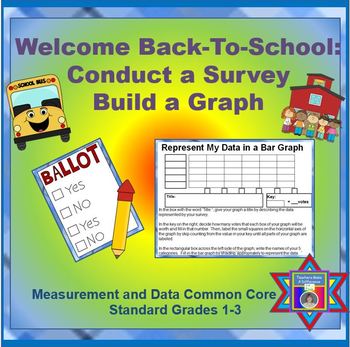
Graphs FREEBIE Back-To-School: Conduct a Survey & Build a Graph (CCSS Aligned)
FREE!!! FREE!!! FREE!!! FREE!!! FREE!!! FREE!!! FREE!!!
PLEASE take time to provide feedback in exchange for the download! I appreciate your time!
I created what I hope to be a fun but helpful resource for your students in Grades 1-3. In return, I ask that you please take time to rate and leave feedback to let others know how the activity worked for you and your students. I appreciate your time and effort!
In Grades 1-3, students are expected to be able to build their own bar
Grades:
1st - 3rd
Types:
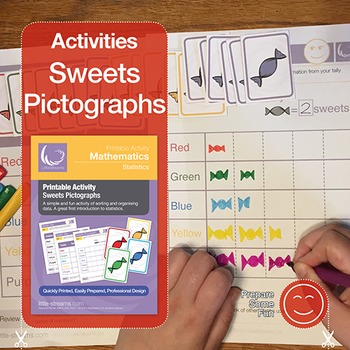
Pictographs Activity
This activity offers a different way to teach tally and pictographs. Students choose 20 sweet cards from the sweet deck (or any amount you choose from the 45 cards). We recommend that 20 cards offers the most interesting collection to work with.Students are invited to collect the data of their chosen cards and write it on the tally sheet. Finally, the students will then plot it on a pictograph. Three pictograph sheets are included, one that has a key of one image = one sweet, one of one image =
Subjects:
Grades:
2nd - 4th
Types:
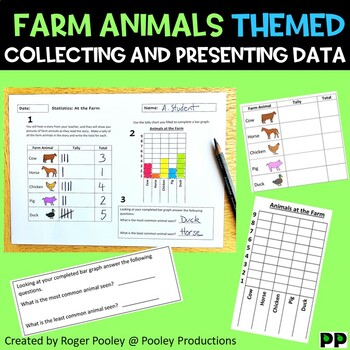
Farm Animals themed Collecting and Presenting Data Grades 1-3 No Prep
This resource is a Statistics recording worksheet in which student collect and present data.Once printed this resource is ready to go at any time.The students are provided with a recording sheet. The teacher reads out a short story or script and the students record data from the story (as it is read) on to their sheet. The story is about a class trip to a farm. Students then collate and display the data before answering a couple of comprehension questions.Students end up with an excellent work
Subjects:
Grades:
1st - 3rd
Types:
CCSS:
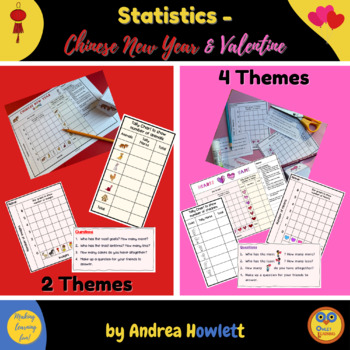
Mathematics - Early Statistics for Chinese New Year & Valentine
What is a bar graph or tally chart? These resources will generate fun for math games and give students opportunities to create data, draw a statistics graph and then answer questions using this information. They are encouraged to make up their own questions for their peers, thereby learning how to interpret a statistics graph and data collection. The cute clipart and competitive element - as this is a 'race to get to the top' - will keep them engaged and motivated to see who will win.This will h
Subjects:
Grades:
PreK - 1st
Types:
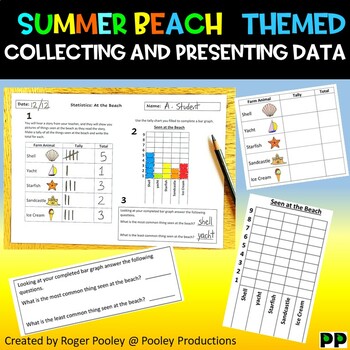
Summer Beach themed Collecting and Presenting Data Grades 1-3 No Prep
This resource is a Statistics recording worksheet in which student collect and present data.Once printed this resource is ready to go at any time.The students are provided with a recording sheet. The teacher reads out a short story or script and the students record data from the story (as it is read) on to their sheet. The story is about a walk on the beach. Students then collate and display the data before answering a couple of comprehension questions.Students end up with an excellent work sam
Subjects:
Grades:
1st - 3rd
Types:
CCSS:
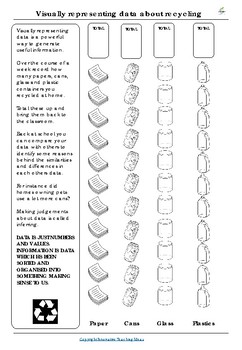
Data and Graphing Recycling Worksheet | Math | Statistics | Earth Day STEM
This worksheet allows students to graph and visually represent data about recycling. Statistics, Data analysis, and Graphing are Key MATH and STEM skills that can be completed independently as homework or in the classroom.THIS WORKSHEET IS ALSO PART OF A MUCH LARGER AND MORE AFFORDABLE BUNDLE HERE.YOU MIGHT ALSO ❤️ THESE ENGLISH RESOURCES❤️ Year-Long Visual Writing Prompts Collection❤️ News and Media Literacy Bundle❤️ 125 Guided Reading Activities for ANY BOOK❤️ HUGE Poetry Powerpack Unit❤️ Wr
Grades:
K - 3rd
Types:
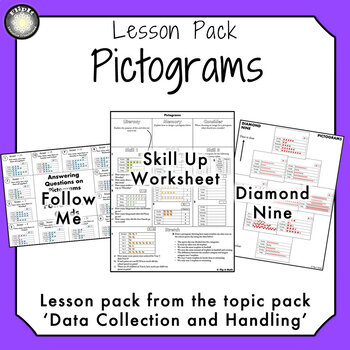
Pictograms
This Pictogram Lesson Pack helps your students to both read pictograms and to create clear and legible pictograms when given frequency tables. It has within it two activities and a skill up worksheet. This pack includes some bonus material to help with the teaching of this lesson.★ Diamond NineGet your students discussing what makes a pictogram clear. This activity is brilliant for getting your students to define themselves what features they need to consider when designing a pictogram.★ Skill U
Subjects:
Grades:
3rd - 5th
Types:
CCSS:
Showing 1-24 of 29 results


