Data and Graphing Recycling Worksheet | Math | Statistics | Earth Day STEM
- PDF
Description
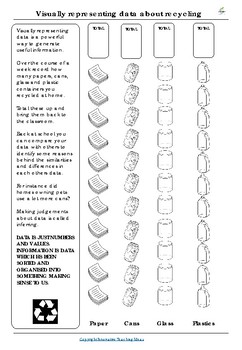
This worksheet allows students to graph and visually represent data about recycling. Statistics, Data analysis, and Graphing are Key MATH and STEM skills that can be completed independently as homework or in the classroom.
THIS WORKSHEET IS ALSO PART OF A MUCH LARGER AND MORE AFFORDABLE BUNDLE HERE.
YOU MIGHT ALSO ❤️ THESE ENGLISH RESOURCES
❤️ Year-Long Visual Writing Prompts Collection
❤️ News and Media Literacy Bundle
❤️ 125 Guided Reading Activities for ANY BOOK
❤️ 101 Digital Graphic Organizers
⭐Let's Connect
Innovative Teaching Ideas on YouTube
Innovative Teaching Ideas on Facebook
TERMS
Copyright © Innovative Teaching Ideas. All rights reserved by the author. This product is to be used by the original downloader only. Copying for more than one teacher, classroom, department, school, or school system is prohibited. This product may not be distributed or displayed digitally for public view. Failure to comply is a copyright infringement and a violation of the Digital Millennium Copyright Act (DMCA). Clipart and elements found in this PDF are copyrighted and cannot be extracted and used outside this file without permission or license. Intended for classroom and personal use ONLY. See the product file for clip art and font credits.
CUSTOMER TIPS:
How to get TPT credit to use on future purchases:
• Please go to your My Purchases page (you may need to
login). Beside each purchase, you'll see a Provide Feedback button. Simply click it, and you will be taken to a page where you can give a quick rating and leave a short comment on the product. Each time you give feedback, TPT gives you feedback credits to lower the cost of your future purchases. I value your feedback greatly as it helps me determine which products are most valuable for your classroom to create more for you. ☺


