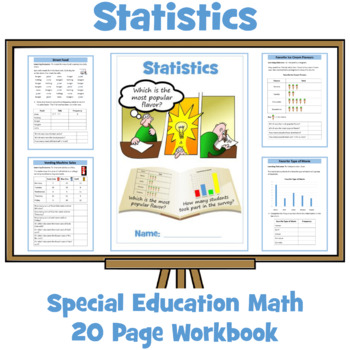
Statistics Workbook - Special Education Math
Inspire and Educate
1.2k Followers
Grade Levels
Not Grade Specific
Subjects
Resource Type
Standards
CCSSK.MD.A.1
CCSSK.MD.A.2
CCSSK.MD.B.3
CCSS1.MD.C.4
CCSS2.MD.D.10
Formats Included
- Zip
Pages
27 pages
Inspire and Educate
1.2k Followers
Description
This math resource has been designed for older Special Education students working at grades 1-2. It contains an age-appropriate, 20-page workbook (20 worksheets) with progress check, certificate of achievement on statistics.
Tasks and activities have been designed to achieve the following outcomes:
- Sort and classify objects using more than one criterion
- Collect information by survey
- Record results in lists, tally charts, and tables
- Construct and interpret pictograms where one picture represents one item
- Interpret simple tables, diagrams, lists and graphs
You may also be interested in other math resources for Special Education students which can be viewed by clicking on the link below.
Special Education Math Resources
Keep informed of new resources by following me here.
Total Pages
27 pages
Answer Key
Included
Teaching Duration
N/A
Report this resource to TPT
Reported resources will be reviewed by our team. Report this resource to let us know if this resource violates TPT’s content guidelines.
Standards
to see state-specific standards (only available in the US).
CCSSK.MD.A.1
Describe measurable attributes of objects, such as length or weight. Describe several measurable attributes of a single object.
CCSSK.MD.A.2
Directly compare two objects with a measurable attribute in common, to see which object has “more of”/“less of” the attribute, and describe the difference. For example, directly compare the heights of two children and describe one child as taller/shorter.
CCSSK.MD.B.3
Classify objects into given categories; count the numbers of objects in each category and sort the categories by count.
CCSS1.MD.C.4
Organize, represent, and interpret data with up to three categories; ask and answer questions about the total number of data points, how many in each category, and how many more or less are in one category than in another.
CCSS2.MD.D.10
Draw a picture graph and a bar graph (with single-unit scale) to represent a data set with up to four categories. Solve simple put-together, take-apart, and compare problems using information presented in a bar graph.


