23 results
Statistics Common Core 3.MD.B.3 centers
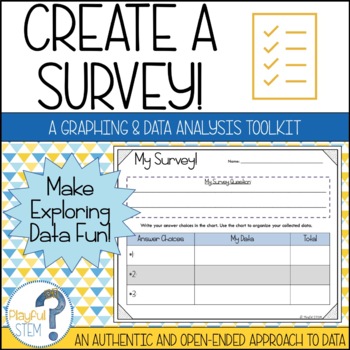
Create Your Own Survey: Collect, Organize, Graph, and Analyze Data
One of my best-selling TPT products -- now updated with a fresh look and new content!Teach Data Analysis the open-ended and engaging way -- through student-directed surveys!This resource pack is designed to help students follow the process of creating a survey: they will brainstorm questions, collect data, organize their obtained data, create multiple graphs to show their data, and then reflect on and analyze what their data tells them.The survey pack includes the following:Brainstorming Survey
Subjects:
Grades:
2nd - 5th
Types:
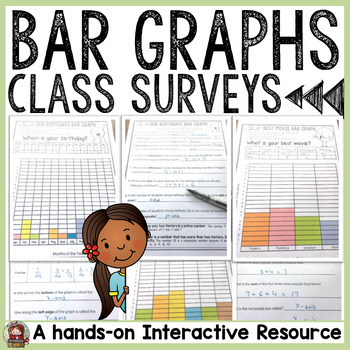
BAR GRAPHS: CLASS SURVEYS ACTIVITIES
BAR GRAPHS: SURVEYSThis Bar Graphs Class Surveys collection features collecting, graphing and interpreting data on topics your students will relate to. This is perfect for a getting-to-know-you back to school activity, or alternatively for applying graphing skills in real life situations.⭐ Separate folders featuring both British English and American spellings and terminology included.►What’s Included✅ 12 Class Surveys on topics of interest.✅ Choice of three Cover Sheets if compiling student su
Subjects:
Grades:
3rd - 6th
Types:
CCSS:
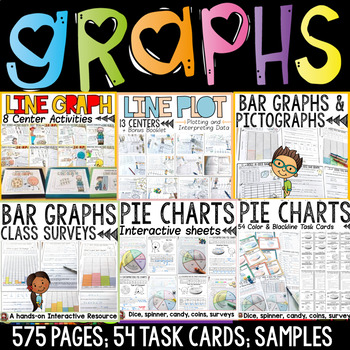
Bar Graphs Pictographs Line Graphs Line Plots Pie Charts Data Collection Bundle
The graphing bundle features interactive activities for creating and interpreting bar graphs, pictographs, line graphs, line plots and pie charts. Your entire graphing unit for a year!Separate folders featuring both British English and US spellings and terminology included.Great quality and value for this whopping 575 + page unit on graphing! Data is collected and interpreted using concrete materials such as visuals, dice, spinners, coins and other real-life objects and contexts. Further details
Subjects:
Grades:
2nd - 6th
Types:
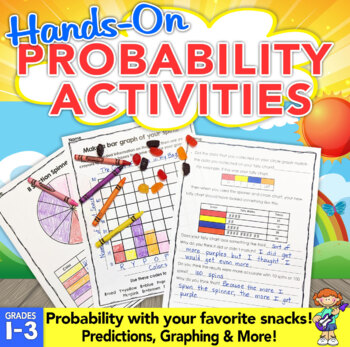
Probability Activities: Hands-On Probability with Snacks!
Probability activities are fun and engaging when you add treats! These fun probability activities allow students to experiment with probability using snacks.Students will use probability to predict, investigate, record data, and learn to use words to describe the chances of something happening.Students will love these probability activities because they are using skills with snacks! Each of the probability activities builds on each other and guides them step-by-step. Easy prep to print off the p
Subjects:
Grades:
1st - 3rd
Types:
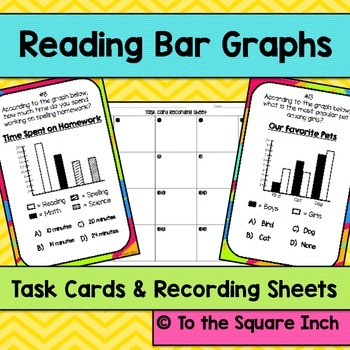
Bar Graphs Task Cards | Math Center Practice Activity
Reading Bar Graphs Task Cards and Record Sheets CCS: 2.MD.10, 3.MD.3
Included in this product:
*20 unique task cards dealing with reading and interpreting bar graphs with different scales (2 per page)
*4 different recording sheets
*Answer Key
Check out addition statistics products HERE
Subjects:
Grades:
2nd - 5th
Types:
Data Analysis Task Cards: A Data, Probability, and Graphing Math Activity
The ability to analyze data to create graphs and tables is a skill that students love to practice. These real life problem-solving scenarios offer students a fun opportunity to work with data in a way that is much more engaging than the standard math worksheet.
By analyzing the scenario presented on each task card, students will be able to determine probability and generate their own bar graphs, dot plots, and pictographs from a set of data.
Fun for math stations or centers, small group work,
Subjects:
Grades:
2nd - 5th
Types:
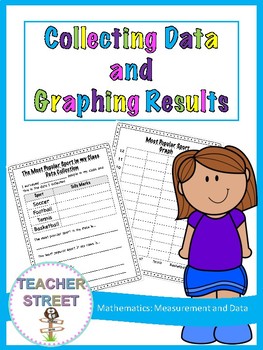
Collecting Data and Graphing Results
Have your students work through the process of collecting, representing and analyzing data.
This pack includes templates for the following topics;
Most Common Pet
Most Popular Sport
Favourite Fruit
Most Popular Book
Favourite Subject
Favourite Shape
Number of Siblings
+ a blank template for students to choose their own topic.
You might like your students to complete all the topics or simply allow them to choose a couple they are interested in.
Each graph comes in two versions.
Numbered up t
Subjects:
Grades:
1st - 3rd
Types:
Roll, Tally, Graph - a data game for Math {Common Core Aligned}
This fun game can be played by your students either alone or in a small group and will help them put into practice what they know about tally marks, as well as giving them the opportunity to create a graph using real data they have collected.
Your PDF download includes a high-quality, full-colour die template for you to print, a student instruction page that you could use for a Mathematics Station, a tally sheet for students to collect data (this could be laminated and written on using a dry-er
Subjects:
Grades:
1st - 4th
Types:
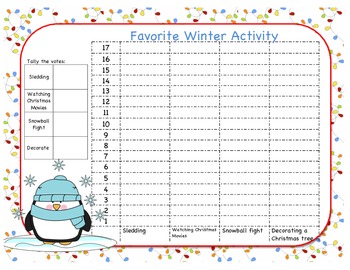
Christmas Graphing
Need a fun, engaging way to teach math during the Christmas season??? In this download, you will get 3 graphing papers as well as 2 differentiated data analysis sheets! Have your students collect data about their favorite Christmas song, candy and winter activity! This is a great activity for the students to get up and move around the classroom!
Grades:
2nd - 5th
Types:
CCSS:
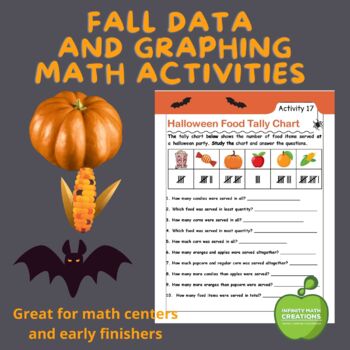
Data and Graph | Fall Activity Packet
Looking for a resource to help your students master data interpretation? This Fall Data and Graphing Activity Pack is perfect for reinforcing those skills.In this packet, students will use graphs and charts to answer questions about data sets. Each activity was curated with fall themes for colorful and creative interaction! The activities in this resource include:pictographsbar graphspie graphstally chartsfrequency chartsThere also includes a fun, halloween-themed project in which students wi
Subjects:
Grades:
2nd - 4th
Types:
Also included in: Halloween Math Activity Bundle: Arithmetic Fun Pack
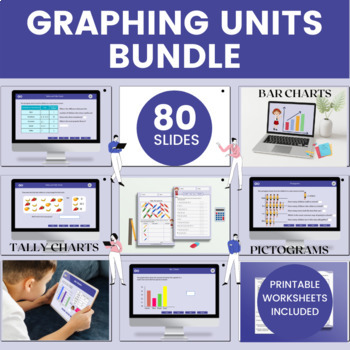
Handling Data - 2nd - 3rd Grade Bundle
Build data handling skills and conceptual knowledge with this enormous collection of interactive Handling Data math activities with free printable worksheets drafted for students of 2nd grade and 3rd grade.What you will get with this fraction math resource:3 products with over 80 interactive slides and dynamic graphics that will engage your third-grade studentsInteractive Drag and Drop activities with instant learner feedbackHandling data Worksheets with answers includedDifferentiated fraction q
Subjects:
Grades:
2nd - 3rd
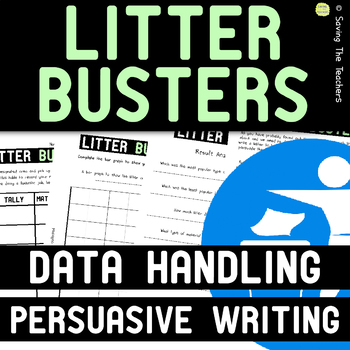
Litter Busters: Project Based Learning - Statistics - Persuasive Writing
Plastic waste is becoming a huge issue around the globe. This activity is a fun way to highlight the problem while spending time outside and learning about data handling / statistics. For this activity, your class will take part in a litter pick, collecting their results in a tally before transferring them onto a bar graph. They will then answer some questions about what they have found out. This activity works best away from the school grounds (beach, park, etc.) - you may need to create a risk
Subjects:
Grades:
3rd - 4th
Also included in: Outdoor Math Activities Growing Bundle
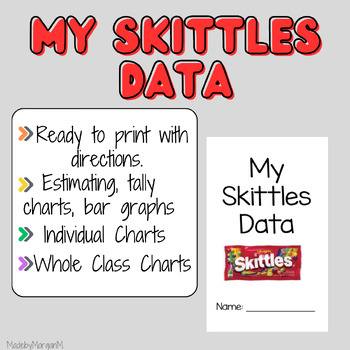
Skittles Data Collecting
Skittles data collection! Use this in your classroom and get each kid a small pack of skittles and they can collect statistics and probability about their pack. Then they will create their own graph before putting the numbers all together to make a class graph! Students love doing this and getting a fun treat in the end. More example pictures coming soon.If you would like to see this product with other types of candy please feel free to send me a message and I would be happy to create it! Please
Subjects:
Grades:
2nd - 5th
Types:
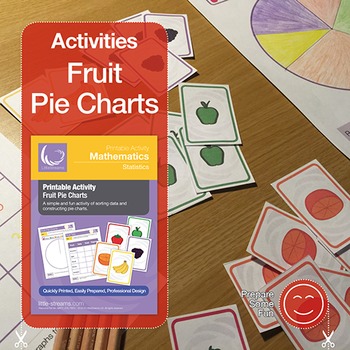
Fruit Pie Charts Activity
This activity offers a different way to teach tally and pie charts. Students choose 20 fruit cards from the fruit deck (or any amount you choose from the 45 cards if you wish to make things more challenging). We recommend that 20 cards offers the most interesting collection to work with, while also being a factor of 360. Students collect the data of their chosen cards and write it on the tally sheet. On the same sheet is a column for working out the number of degrees needed for constructing the
Subjects:
Grades:
2nd - 4th
Types:
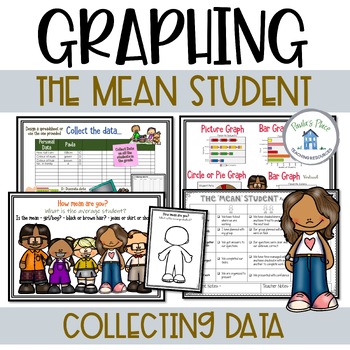
Graphing the Mean | Your Mean Student - Project Based Learning
Graphing the Mean - Your students will experience a math task that will lead to a group presentation. They will compose questions, collect data, collate data, determine the ‘mean’, show the data in various graphs and design a poster to present the ‘mean student’.Slides include-What the unit will cover-How mean are you? What will you be looking for?-What is the mean?-How mean are you?-Template for recording the mean student-Ideas for recording data-Group guidelines – it’s your turn-Types of graph
Subjects:
Grades:
4th - 6th
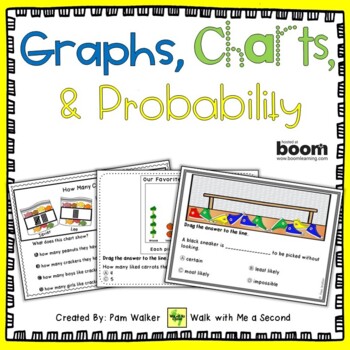
Graphing and Data with Boom Cards
This deck of 30 slides focuses on practice for the reading of charts, graphs, and data with six different presentations of data. This type of reading can be as challenging as text reading without practice.The click-to-answer plus drag-and-drop functions are easy to use for young learners. Like all Boom Cards, the answers are self-checking, so students get immediate feedback. The graph topics are engaging, too. Great for large or small groups, follow-up to lessons, distributive practice, independ
Subjects:
Grades:
1st - 3rd
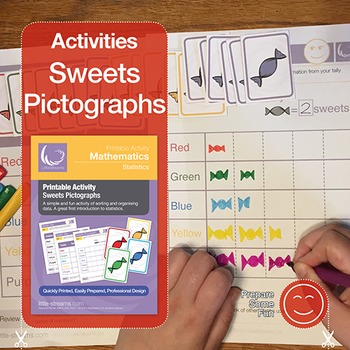
Pictographs Activity
This activity offers a different way to teach tally and pictographs. Students choose 20 sweet cards from the sweet deck (or any amount you choose from the 45 cards). We recommend that 20 cards offers the most interesting collection to work with.Students are invited to collect the data of their chosen cards and write it on the tally sheet. Finally, the students will then plot it on a pictograph. Three pictograph sheets are included, one that has a key of one image = one sweet, one of one image =
Subjects:
Grades:
2nd - 4th
Types:
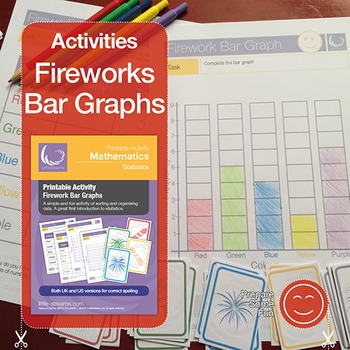
Firework Bar Charts
This activity offers a different way to teach tally and bar graphs. Students choose 20 firework cards from the firework deck (or any amount you choose from the 45 cards). We find that 20 cards offers the most interesting collection to work with.Students are invited to collect the data of their chosen cards and write it on the tally sheet. Finally, the students will then plot it on a bar graph. The nature of this activity means that each student should, in theory, produce their own tally and bar
Subjects:
Grades:
1st - 4th
Types:
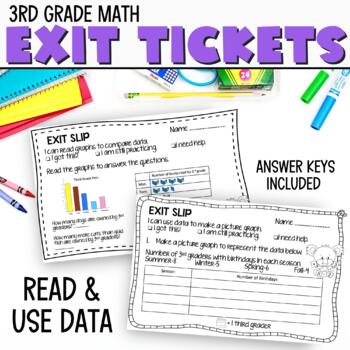
3rd Grade Math Exit Tickets for Reading and Using Data - Quick Check Assessments
Doing a quick check for 3rd grade reading and using data concepts with math exit tickets makes it fun for kids and quick for the teacher. This set of reading and using data exit tickets is the perfect bite-sized assessment to wrap up one math lesson before moving on to the next one! These reading and using data exit tickets are a great option is a great option if you looking for a quick and easy way to see if your students are learning the 3rd grade math concepts that they need so they don't fa
Subjects:
Grades:
2nd - 4th
Types:
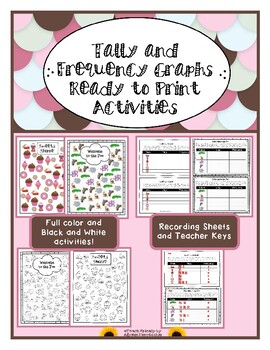
Tally and Frequency Graph Ready to Print Activities!
This is a fun, ready to print resource that my students loved! Students use the provided pages to sort data onto a tally and frequency table. This resource comes in both black and white as well as full color! It includes everything you need to print and go as well as teacher keys!
Subjects:
Grades:
2nd - 4th
Types:
CCSS:
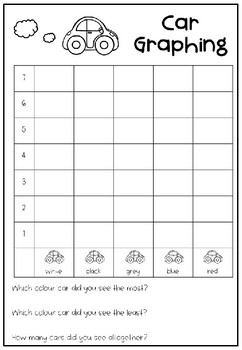
Car Graphing Activity Freebie!
This is the perfect opportunity to bring learning outdoors! For this fun graphing activity, students sit where they can see cars driving past and need to graph the different coloured cars that they see. After they have completed the graph, students answer questions and make simple inferences.Comes in coloured or B&W.
Subjects:
Grades:
K - 2nd
Types:
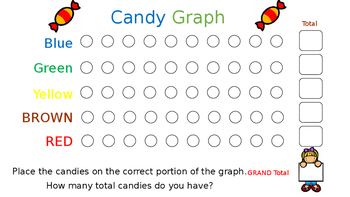
Candy Graph and Candy Math
This two part lesson will have your kids excited about math time. Part 1 has them graphing with real candies and can help introduce concept of graphs. Part 2 is more advanced and introduces minimum, maximum, and average.
The kids can work on their own or in teams.
Subjects:
Grades:
2nd - 4th
Types:
CCSS:

Building Blocks
This is an activity that can be used with students to reinforce knowledge of mean, median, mode and range. It also allows students to see a more hands-on approach to mathematics through building towers of blocks as tall as possible in a given amount of time.
Subjects:
Grades:
3rd - 5th
Types:
Showing 1-23 of 23 results


