613 results
Graphing Common Core 3.MD.B.3 printables
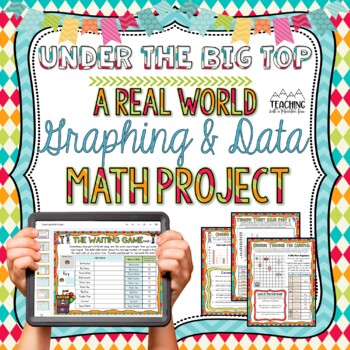
Graphing and Data Math Project
Your students will love working on this digital and printable 12-page graphing and data math project with a fun and engaging carnival theme! They will interpret data tables and graphs as well as create their own data tables and graphs. Each page also includes tasks and questions about each graph!The pages stand alone, so you can use a few of the pages or all of them depending on how much time you have and the skills your students are ready to review. (Making them PERFECT for DIFFERENTIATION!)W
Subjects:
Grades:
3rd - 6th
Types:
Also included in: Math Projects BUNDLE | Real-World Activities for Math Skills
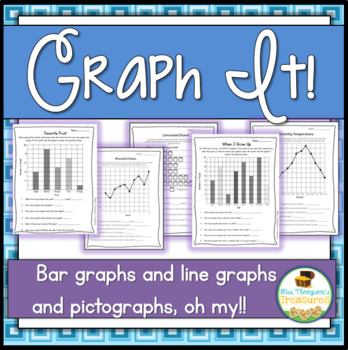
Graphing Practice Printable Activities
This pack is full of activities to help your students practice creating and interpreting graphs! 18 graphs total!*9 graphs with information already filled in and the students interpret the data by answering the questions (ex: How many more students like apples than grapes?) (3 bar graphs, 3 pictographs, 3 line plot graphs)*9 "Ask the Class" graphs - Go around the room and have students answer the question with their pick from the list (ex: What is your favorite color?) Students will record the d
Subjects:
Grades:
2nd - 3rd
Types:
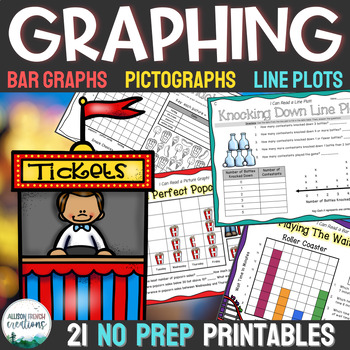
Graphing Worksheets Activity Packet - Pictograph, Line Plot, Bar Graph 3rd Grade
NO PREP GRAPHING UNIT! If you're looking for fun, engaging activities to teach your students about bar graphs, pictographs, and line plots...you've found it! This resource is a huge time saver for whole group math time, small group, and independent centers or workstations! Overview of What's Included (more details below)Pictographs:3 Read and Respond pictograph worksheets (analyze & interpret data from graph) 3 Create and Respond pictograph worksheets (use data to create graph) Bar Graphs:4
Subjects:
Grades:
2nd - 4th
Types:
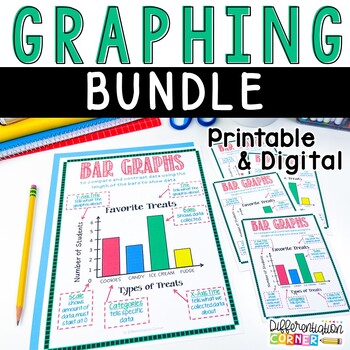
Graphing Activity Bundle: Bar Graphs, Pictographs, Line Plots Digital Printable
Your students will love these engaging data and graphing activities for bar graphs, pictographs and line plots! Printable graphing worksheets, anchor charts, and digital graphing activities are all ready for you in a snap to save you time!Colorful graphing anchor charts for bar graphs, line plots and picture graphs included in both large and small copies! Students will enjoy graphing practice with these differentiated graphing worksheets. PRINTABLES-✔Anchor Charts Bar Graph Pictograph /
Subjects:
Grades:
3rd - 5th
Types:
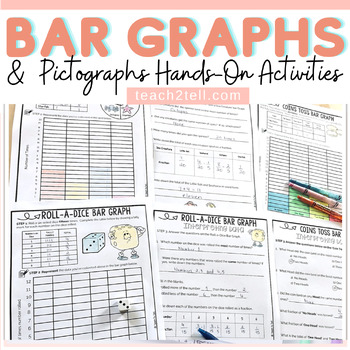
Bar Graphs Worksheets & Bar Graphs Activities Pictographs Picture Graphs
This collection of interactive worksheets feature interpreting data in bar graphs and pictographs. Data is collected using concrete materials such as visuals, dice, spinners, coins and M&M’s. This data is then represented in bar graphs and interpreted. The section on pictographs requires collected data to be interpreted.US and British English spellings and terminology files included.These no-prep printables facilitate students to move from the concrete to the abstract. Graphs target students
Subjects:
Grades:
3rd - 6th
Types:
CCSS:
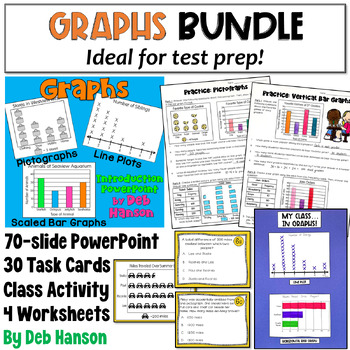
Graphs Bundle: Scaled Bar Graphs, Pictographs, and Line Plots
This graphing bundle has everything you need to teach third and fourth-grade students about representing and interpreting data. The activities in this math bundle make learning how to interact with common types of graphs fun and easy! Students love the activities while teachers love the convenience of these no-prep resources that can be used year after year! These graphing activities can be used for test prep, review, or introduction of math concepts related to graphing. The activities in this b
Subjects:
Grades:
3rd - 4th
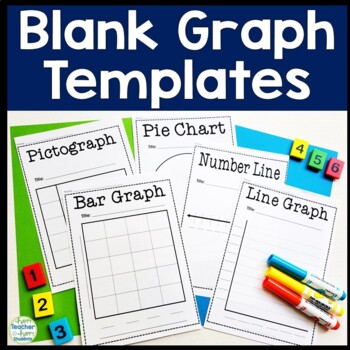
Blank Graph Templates: Bar Graph, Pie Chart, Pictograph, Line Graph, Number Line
Blank Graph Templates: Full & Half-Page Templates This resource includes 6 blank graph templates: blank Bar Graph template (2 size options), blank Pie Chart template, blank Pictograph template, blank Line Graph template & a blank Number Line template. Each blank graph includes a full page and half-page (2 per page) option.These blank graph templates can be used in unlimited ways in a classroom. Happy teaching!** Click HERE for a Graphing Test (includes Bar Graph, Pictograph, Line Graph &
Subjects:
Grades:
K - 3rd
Types:
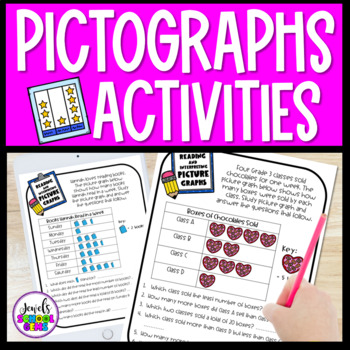
Data Sorting and Picture Graphs Worksheets & Activities | Pictographs
Help your students master the data standards with this fun and engaging picture graphs worksheets and activities set. In this Data Sorting and Picture Graphs Worksheets and Activities resource, students learn about data sorting and picture graphs the fun, hands-on way. You will love how easy this print-and-go resource makes your teacher life! Your students will love drawing, cutting, pasting, coloring, using concrete materials, like a die, a spinner, a coin, and a bag of candies to complete thes
Grades:
1st - 3rd
Types:
CCSS:
Also included in: Data & Graphing Activities | Bar Graphs and Pictographs Worksheets
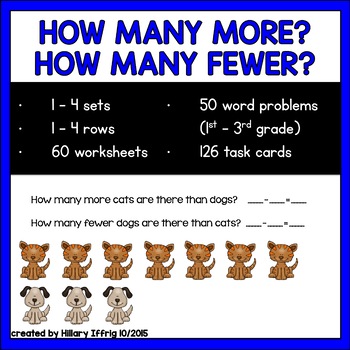
How Many More? How Many Fewer? (16 Google Slides!)
How many more and how many fewer is a difficult task. These worksheets, word problems, and task cards (new 10/2019) & 16 GOOGLE SLIDES (via PDF link will help your kids gain understanding. Use graphics with scaffolded practice 1st grade - 3rd grade. Subtraction for all and multiplication for older grades. Updated with TASK CARDS & BLANK KEYS, choose your own numbers. Big Update, Cleaner Look, Please Re-download 10/2019*16 Google Slides* as a trial (jan 2021), more may be added60 work
Subjects:
Grades:
1st - 3rd
Types:
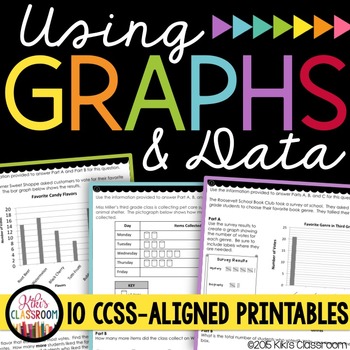
All Types of Graphs - Bar Graphs, Picture Graphs, & Interpreting Graphs
Using Graphs & Data: 3.MD.3 includes 11 pages of thoughtfully designed graphing & data worksheets focusing on CCSS 3.MD.3, the 3rd Grade Common Core standard. In order to build their skills, children are asked to:• interpret information presented in graphs; • to solve one- and two-step "how many more" problems using bar graphs and pictographs; • to create bar graphs and pictographs using data provided; • use monthly calendars to solve problems; • to interpret information in multiple way
Subjects:
Grades:
2nd - 4th
Types:
CCSS:
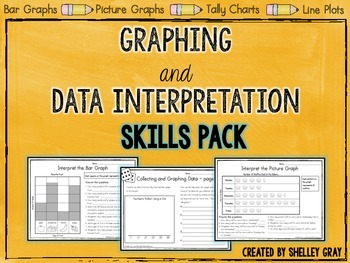
Graphing and Data Activities for Interpreting Graphs 3rd and 4th Grade
This Skills Pack includes 42 Graphing and Data Interpretation activities that will reinforce data collection/interpretation skills in your classroom. Graphs include: bar graphs, picture graphs, line plots and tally charts. Students will have the opportunity to read and interpret all these kinds of graphs. They will also have the opportunity to collect their own data and record it using the graphs listed above.The bar graphs and picture graphs involve many-to-one correspondence. The tally charts
Grades:
3rd - 4th
Types:
CCSS:
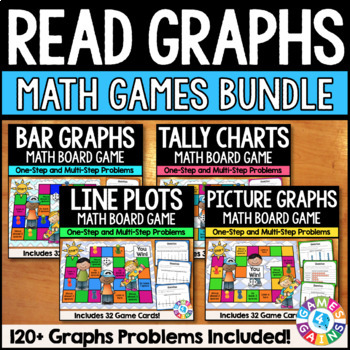
Line Plots with Fractions, Bar & Picture Graphs and Data Activity Game 3rd Grade
Looking for fun math games to help your 3rd students practice line plots with fractions, bar graphs, picture graphs (pictographs), and tally charts? This 3rd Grade Graphs and Data Games Bundle includes four board games with 90+ task cards for practicing line plots with fractions, bar graphs, picture graphs (pictographs), and tally charts. These exciting and easy-to-prep math games will get your students excited to practice their data and graphing skills! You'll save $$ when you buy this bundle..
Subjects:
Grades:
3rd
Types:
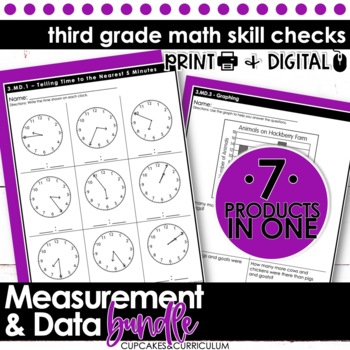
3rd Grade Measurement Worksheets for Bar Graphs, Area, Perimeter & Telling Time
This BUNDLED third grade math resource includes printable and digital math worksheets that give your third graders practice solving telling time to the nearest minute, working with picture graphs and bar graphs, measuring to the quarter inch, finding area/perimeter and more (3MD1, 3MD2, 3MD3, 3MD4, 3MD5/6, 3MD7, 3MD8). These Common Core aligned math quick checks are perfect for morning work, assessment, homework, review, fast-finisher activities, exit tickets, and math centers.These math workshe
Subjects:
Grades:
3rd
Types:
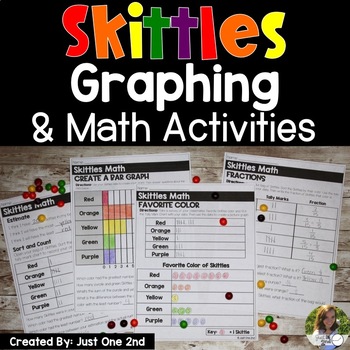
Skittles Graphing & Math Activities
Food + Math = A Fun and Engaging Math Activity! This product includes 18 worksheets to use with Skittles Candy. Each student will be given a bag of Skittles to use for the activity and afterwards students may eat them. Who doesn’t love eating candy while doing math??The worksheets include the following activities/skills:- Estimation- Counting and Sorting- Creating a Tally Mark Chart- Creating a Picture Graph- Creating a Bar Graph- Creating a Line Plot- Taking a Survey of Student’s Favorite Skitt
Subjects:
Grades:
1st - 3rd
Types:
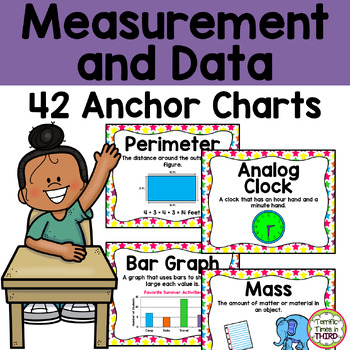
Measurement and Data Anchor Charts and Posters
These 42 anchor charts will provide students with the concepts and vocabulary used with measurement and data. Each anchor chart is full page size - 8.5 x 11 inches. There is no prep work, just print and go!These posters are perfect for a classroom bulletin board, focus wall, math centers, or as student handouts. These charts come in color and black & white to best fit your needs. Print and display these charts to give a vibrant and informative visual for students that can be used year after
Subjects:
Grades:
1st - 4th
Also included in: Math Anchor Charts and Posters Bundle
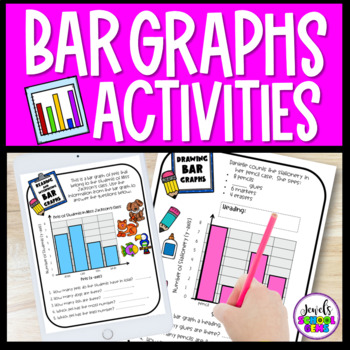
Data Sorting and Bar Graphs Worksheets & Activities
Introduce your students to data sorting with fun and engaging bar graphs worksheets and activities they will love. With the Data Sorting and Bar Graphs Worksheets and Activities in this set, students learn about data sorting and bar graphs the fun way. You will love how easy this print-and-go resource makes your teacher life! Your students will love drawing, cutting, pasting, coloring, using concrete materials like a die, a spinner, a coin, and a bag of candies to complete these fun data sorting
Grades:
1st - 3rd
Types:
CCSS:
Also included in: Data & Graphing Activities | Bar Graphs and Pictographs Worksheets
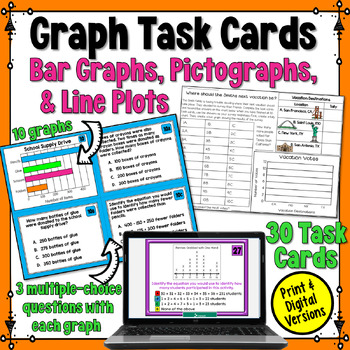
Graphing Task Cards: Scaled Picture & Bar Graphs, Line Plots 3rd Grade Practice
Graphing Task Cards: This set of 30 task cards is designed to give your third-grade students the opportunity to practice solving a variety of graph and data questions written in a multiple-choice format. Students will have many opportunities to interpret various types of graphs. It includes scaled bar graphs in both vertical and horizontal orientations. Scaled picture graphs and line plots are also included. For each graph provided, three questions follow.Students will interact with the data on:
Subjects:
Grades:
3rd - 4th
Types:
Also included in: Graphs Bundle: Scaled Bar Graphs, Pictographs, and Line Plots
Graphs Interactive Notebook for 3rd Grade
“LOVE LOVE LOVE each of these- my kiddos get tired of worksheets this is a great format easy to print- thorough, and overall an engaging way to get through math concepts.” – Deana D“These things are so neat! I love the hands-on approach. I use these after I've taught a quick lesson on the topic and the kids are able to do the activities quickly. They love setting everything up and I love that at the end of it, they will get to see all their hard work!”- Jayme O“I’m not good at math.”“Math is har
Subjects:
Grades:
3rd
Types:
Also included in: Math Interactive Notebook Bundle for 3rd Grade
Guided Math 3rd Grade Graphs, Data, and Finance Unit 8
Guided Math Whole Group and Teacher-Led Small Group Lessons for Third GradeDownload the Free Standards-Alignment for Guided MathGraphs, Data, and Personal Finance Unit Focus Graphs and Data- frequency tables, dot plots, bar graphs, and pictographs. Students learn how to read and interpret the information presented in the graph through interactive note-booking, practice pages, math hunts, and reviews.Personal Finance- Students are introduced to several new terms: income, credit, interest, scarcit
Subjects:
Grades:
3rd
Types:
Also included in: 3rd Grade Guided Math Bundle
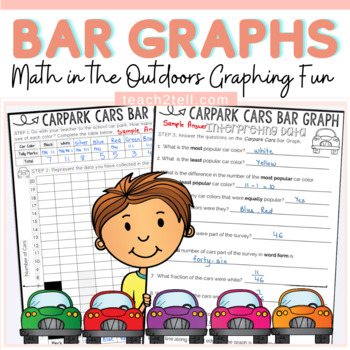
Bar Graphs Worksheets Collecting and Interpreting Data and Graphing Activity
Need a fun bar graphing and data collection activity? These free bar graph worksheets will get your students out of the four walls of the classroom and into the outdoors. Students will graph the car colors in the Staff Car Park. They will have the opportunity to use tally marks to collect data to construct a bar graph. A set of questions also require students to interpret the constructed bar graph. Not only will learning be more realistic but it will also be a welcome change, perhaps from the da
Subjects:
Grades:
2nd - 6th
Types:
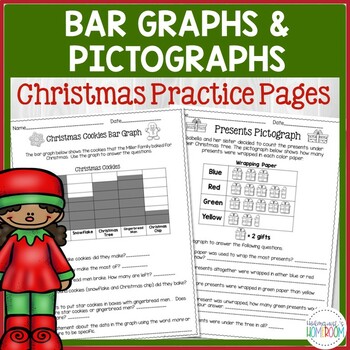
Christmas Math - Bar Graphs & Pictographs
This is a Christmas-themed collection of graphing activities that will give your students practice to reading, interpreting, and creating bar graphs and pictographs. Practice pages include the following:*two activities where students answer questions about graphs that are already completed.*two activities where they use data to create graphs. *two pages where students will write their own questions about the data in a bar graph and pictograph. *The final activity has students collecting their o
Subjects:
Grades:
3rd - 4th
Types:
CCSS:
Also included in: Bar Graphs & Pictographs Year Long Bundle
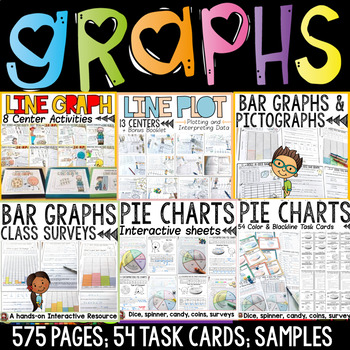
Bar Graphs Pictographs Line Graphs Line Plots Pie Charts Data Collection Bundle
The graphing bundle features interactive activities for creating and interpreting bar graphs, pictographs, line graphs, line plots and pie charts. Your entire graphing unit for a year!Separate folders featuring both British English and US spellings and terminology included.Great quality and value for this whopping 575 + page unit on graphing! Data is collected and interpreted using concrete materials such as visuals, dice, spinners, coins and other real-life objects and contexts. Further details
Subjects:
Grades:
2nd - 6th
Types:
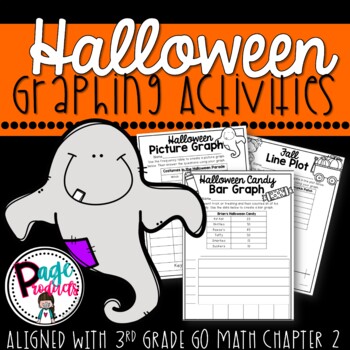
Halloween Graphing Activities 3.MD.3 Aligned with 3rd Grade Go Math Chapter 2
Students will love these Halloween themed graphing activities! The product includes the following ready-to-print resources;*Line Plot Activity with Questions*Bar Graph Activity with Questions* Picture Graph Activity with Questions*Keys for each activity.Each activity is aligned with common core standard 3.MD.3 and 3rd Grade Go Math Chapter 2.
Subjects:
Grades:
2nd - 5th
Types:
Also included in: 3rd Grade Math Resources (Aligned with GO Math)
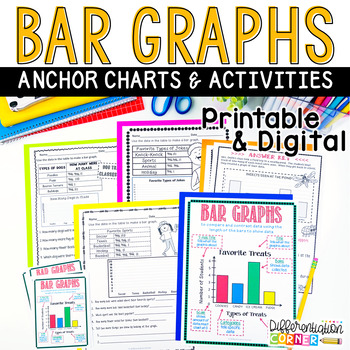
Bar Graph Worksheets and Anchor Charts Digital & Printable Math Activities
Bar Graph practice has never been so fun! This highly fun and engaging bar graph resource will have students reading and creating their own bar graphs with worksheets and anchor charts with paper/pencil AND digital interactive options.Quickly assign in Google Classroom or print and go for graphing math centers, sub plans or individual seat work, or project on your whiteboard for your math lesson plans!This resource includes:Bar Graph Anchor ChartsStudent copies of anchor chart for interactive no
Subjects:
Grades:
2nd - 4th
Types:
CCSS:
Showing 1-24 of 613 results


