TPT
Total:
$0.00

Graphing Practice Printable Activities

Rated 4.89 out of 5, based on 848 reviews
4.9 (848 ratings)
;
Mrs Thompson's Treasures
45.9k Followers
Grade Levels
2nd - 3rd
Standards
Formats Included
  • PDF
Pages
21 pages
$5.00
$5.00
Share this resource
Report this resource to TPT
Mrs Thompson's Treasures
45.9k Followers

What educators are saying

Excellent resource to help my resource students. I love how cleanly it's laid out. It covered various types of graphs with various skills. Highly recommend.
Thank you for creating this amazing resource. It was very time saving as well. Love how this resource was being organized.

Description

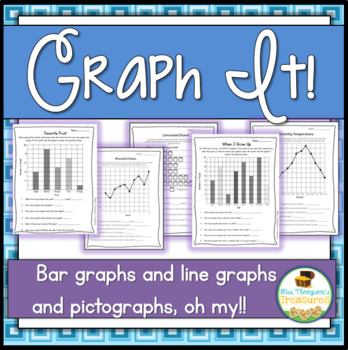
This pack is full of activities to help your students practice creating and interpreting graphs!

18 graphs total!

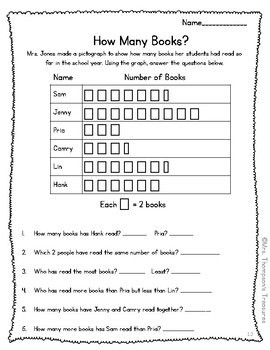
*9 graphs with information already filled in and the students interpret the data by answering the questions (ex: How many more students like apples than grapes?) (3 bar graphs, 3 pictographs, 3 line plot graphs)

*9 "Ask the Class" graphs - Go around the room and have students answer the question with their pick from the list (ex: What is your favorite color?) Students will record the data using tally marks, fill in the information on the graph provided, then answer a few questions about the data. (3 bar graphs, 3 pictographs, 3 line plot graphs)

***********************************************************************

For more graphing fun, you may also like:

Symmetry Fun Mystery Picture Graphs

Mystery Picture Graphs - Spring/ St. Patrick's Day Pack

Mystery Picture Graphs - Easter Pack

************************************************************************

**Follow me to keep updated on new products, sales, and freebies! Just click the green star by my store name near the top of the page!

Mrs. Thompson's Treasures

Total Pages
21 pages
Answer Key
Included
Teaching Duration
N/A
Last updated Apr 14th, 2019
Report this resource to TPT
Reported resources will be reviewed by our team. Report this resource to let us know if this resource violates TPT’s content guidelines.

Standards

to see state-specific standards (only available in the US).
Draw a picture graph and a bar graph (with single-unit scale) to represent a data set with up to four categories. Solve simple put-together, take-apart, and compare problems using information presented in a bar graph.
Draw a scaled picture graph and a scaled bar graph to represent a data set with several categories. Solve one- and two-step “how many more” and “how many less” problems using information presented in scaled bar graphs. For example, draw a bar graph in which each square in the bar graph might represent 5 pets.
Make a line plot to display a data set of measurements in fractions of a unit (1/2, 1/4, 1/8). Solve problems involving addition and subtraction of fractions by using information presented in line plots. For example, from a line plot find and interpret the difference in length between the longest and shortest specimens in an insect collection.

Reviews

Questions & Answers

45.9k Followers