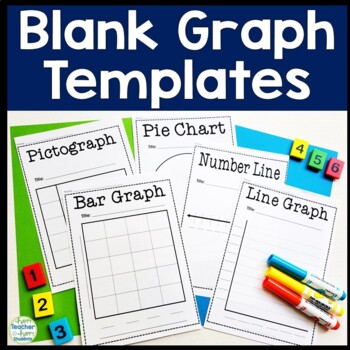
Blank Graph Templates: Bar Graph, Pie Chart, Pictograph, Line Graph, Number Line
- PDF
What educators are saying
Also included in
- This bundle contains 3 best-selling Graphing Products perfect for 2nd, 3rd, 4th & 5th grade students. This bundle is 30% OFF rather than buying the products individually. Look at individual product listings for more information. 1. Blank Graph Templates: Bar Graph, Pie Chart, Pictograph, Line GrPrice $6.75Original Price $9.75Save $3.00
Description
Blank Graph Templates: Full & Half-Page Templates This resource includes 6 blank graph templates: blank Bar Graph template (2 size options), blank Pie Chart template, blank Pictograph template, blank Line Graph template & a blank Number Line template.
Each blank graph includes a full page and half-page (2 per page) option.
These blank graph templates can be used in unlimited ways in a classroom.
Happy teaching!
** Click HERE for a Graphing Test (includes Bar Graph, Pictograph, Line Graph & Pie Chart) **
Looking for more Happy Teacher Happy Students Math Resources?
❤ Simplifying Fractions Leveled Worksheets with test
❤ Simplifying Fractions with Candy!
❤ Geometry Activity - Find Geometry in Your Name!
❤ Click HERE to view 750+ resources by Happy Teacher Happy Students ❤
************************************************************************************************
Join for Exclusive Freebies, Tips & Tricks
⭐Happy Teacher Happy Students Blog
Visit My Blog and Chat All Things Teaching!
⭐Instagram: Let's be friends!
Use one of my resources in your class or homeschool? I want to see it!
Tag me @happyteacherhappystudents in your photo I’ll send you a special freebie.
⭐ Questions? Looking for something not already in my store?
Contact Me @ happyteacherhappystudents@yahoo.com
************************************************************************************************
** Visit my STORE and click on the 'green star' to follow me and be the first to know about new products, sales & freebies!
** Please remember to rate this product so that you earn TPT Credits for future purchases!
Copyright © Happy Teacher Happy Students. All rights reserved. This file is intended for classroom and personal use only. Any redistribution or reproduction of part or all of the contents in any form is prohibited other than the following:
**You may print for your personal, classroom use, and non-commercial use only.
**Clipart, graphics, photographs, found inside this product are copyrighted. They may not be extracted from this file without written permission from the original artist(s).


