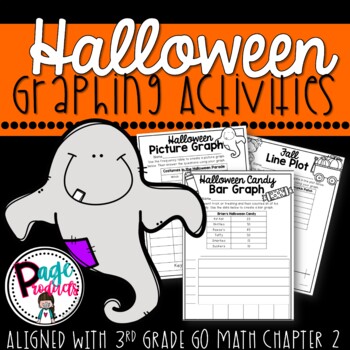
Halloween Graphing Activities 3.MD.3 Aligned with 3rd Grade Go Math Chapter 2
Page Products
1.4k Followers
Resource Type
Standards
CCSS2.MD.D.10
CCSS3.MD.B.3
CCSS4.MD.B.4
Formats Included
- PDF
Pages
12 pages
Page Products
1.4k Followers
What educators are saying
My students loved this resource. It was such a good way to incorporate graphing with all the halloween crazy going on around us.
Also included in
- Several engaging 3rd grade math activities that go beyond the textbook. Project based activities, games, centers and so much more! All activities are Common Core and GO Math Aligned. This bundle includes 24 resources!Price $35.00Original Price $66.50Save $31.50
- Get ready to rock Halloween with this fun and engaging 3rd Grade Halloween Bundle. 6 resources aligned with 3rd grade standards are perfect to keep learning the center of this fun day.This Bundle Includes:3 Language Arts Resources:Halloween Would You Rather -Would You Rather activities provide a grePrice $15.50Original Price $18.00Save $2.50
Description
Students will love these Halloween themed graphing activities! The product includes the following ready-to-print resources;
*Line Plot Activity with Questions
*Bar Graph Activity with Questions
* Picture Graph Activity with Questions
*Keys for each activity.
Each activity is aligned with common core standard 3.MD.3 and 3rd Grade Go Math Chapter 2.
Total Pages
12 pages
Answer Key
N/A
Teaching Duration
30 minutes
Report this resource to TPT
Reported resources will be reviewed by our team. Report this resource to let us know if this resource violates TPT’s content guidelines.
Standards
to see state-specific standards (only available in the US).
CCSS2.MD.D.10
Draw a picture graph and a bar graph (with single-unit scale) to represent a data set with up to four categories. Solve simple put-together, take-apart, and compare problems using information presented in a bar graph.
CCSS3.MD.B.3
Draw a scaled picture graph and a scaled bar graph to represent a data set with several categories. Solve one- and two-step “how many more” and “how many less” problems using information presented in scaled bar graphs. For example, draw a bar graph in which each square in the bar graph might represent 5 pets.
CCSS4.MD.B.4
Make a line plot to display a data set of measurements in fractions of a unit (1/2, 1/4, 1/8). Solve problems involving addition and subtraction of fractions by using information presented in line plots. For example, from a line plot find and interpret the difference in length between the longest and shortest specimens in an insect collection.


