9 results
Statistics Common Core K.MD.A.2 resources
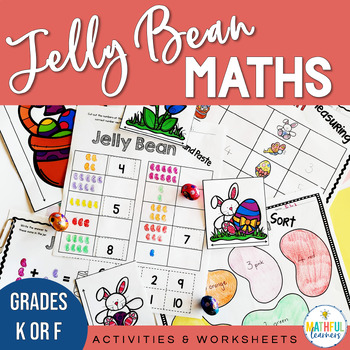
Jelly Bean Math - Easter Themed No Prep Math Activities & Worksheets
This Jelly Bean Math pack of no prep Math activities and worksheets is fun, engaging and your students will love it! This 25 page pack will help you cover many areas of the Math Curriculum in just ONE week. The Easter themed Math activities and worksheets are perfect for that week before Easter, or anytime of year. It contains activities relating to numbers, counting, addition and subtraction, shape, data collection and measurement all perfect for Kindergarten/Foundation students.A week of your
Subjects:
Grades:
PreK - 1st
Types:
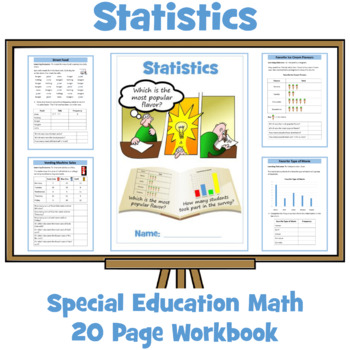
Statistics Workbook - Special Education Math
This math resource has been designed for older Special Education students working at grades 1-2. It contains an age-appropriate, 20-page workbook (20 worksheets) with progress check, certificate of achievement on statistics. Tasks and activities have been designed to achieve the following outcomes:Sort and classify objects using more than one criterionCollect information by surveyRecord results in lists, tally charts, and tablesConstruct and interpret pictograms where one picture represents one
Subjects:
Grades:
Not Grade Specific
Types:
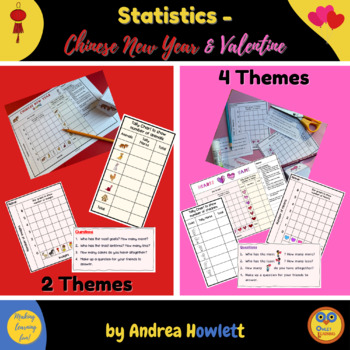
Mathematics - Early Statistics for Chinese New Year & Valentine
What is a bar graph or tally chart? These resources will generate fun for math games and give students opportunities to create data, draw a statistics graph and then answer questions using this information. They are encouraged to make up their own questions for their peers, thereby learning how to interpret a statistics graph and data collection. The cute clipart and competitive element - as this is a 'race to get to the top' - will keep them engaged and motivated to see who will win.This will h
Subjects:
Grades:
PreK - 1st
Types:
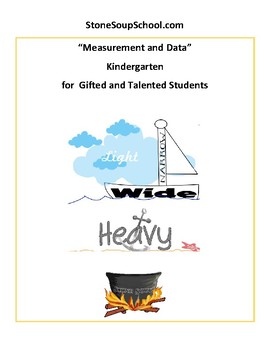
K, CCS: "Measurement and Data" for the Gifted/Talented
Gifted and talented students require increased creativity and depth of learning. Here is the link to gifted and talented teaching strategies: https://www.teacherspayteachers.com/Product/Gifte... Accessibility suggestions: Go to your device “Settings” where you can adjust the screen’s: brightness and color, size of text, resolution, connect to wireless display and adjust sound. A media player for wav or m4a files is required to listen to audio links. This educational resource pack includes:
Subjects:
Grades:
K
Types:
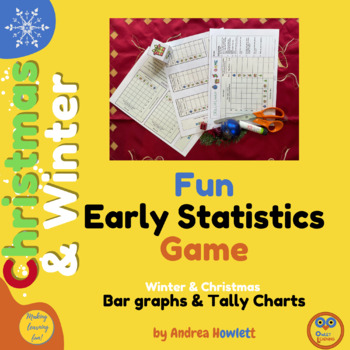
Christmas Fun Maths Games - Bar Graphs & Tally Charts
These Christmas resources will generate fun for math games and give students opportunities to create data, draw a statistics graph, such as a bar graph or tally chart, and answer questions by using this information. They are encouraged to make up their own questions for their peers thereby learning how to interpret a statistics table and data collection. The tally chart and bar graphs creator - the die or dice - has cute clipart to make this appealing to children. How will this help the students
Subjects:
Grades:
K - 3rd
Types:
Also included in: Christmas Statistics & Number Bundle
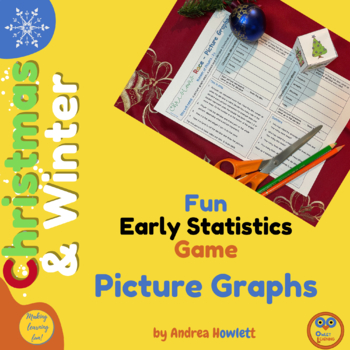
Christmas Fun Maths Games - Picture Graphs
What is pictogram or a picture graph? These resources will generate fun for math games and give students opportunities to create data, draw a statistics graph and then answer questions by using this information. They are encouraged to make up their own questions for their peers thereby learning how to interpret a statistics table and data collection. This will help your students by: enjoying math/ mathsbeing funlearning about picture graphs/ pictogramsbecoming more confident in understanding how
Subjects:
Grades:
K - 3rd
Types:
Also included in: Christmas Statistics & Number Bundle
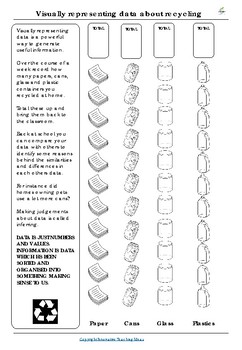
Data and Graphing Recycling Worksheet | Math | Statistics | Earth Day STEM
This worksheet allows students to graph and visually represent data about recycling. Statistics, Data analysis, and Graphing are Key MATH and STEM skills that can be completed independently as homework or in the classroom.THIS WORKSHEET IS ALSO PART OF A MUCH LARGER AND MORE AFFORDABLE BUNDLE HERE.YOU MIGHT ALSO ❤️ THESE ENGLISH RESOURCES❤️ Year-Long Visual Writing Prompts Collection❤️ News and Media Literacy Bundle❤️ 125 Guided Reading Activities for ANY BOOK❤️ HUGE Poetry Powerpack Unit❤️ Wr
Grades:
K - 3rd
Types:
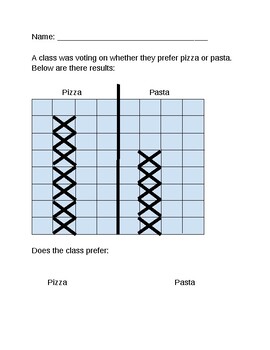
Kinder Data Exit Ticket
Use this exit ticket to assess understanding of data in a table, and comparison of quantities to answer questions.
Subjects:
Grades:
K
Types:
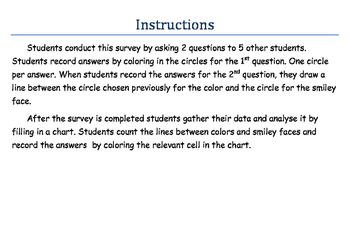
How do you express yourself with colors and feelings
How do your students express themselves with colors and feelings? Want to find out? Use this survey and find out! Students will make connections between colors and feelings, as well as improve their interviewing skills.
This survey worksheet is a great tool to use for students to work on their questioning, data and analyzing skills. It also helps to improve their one-to-one connection.
Subjects:
Grades:
K - 1st
Types:
Showing 1-9 of 9 results


