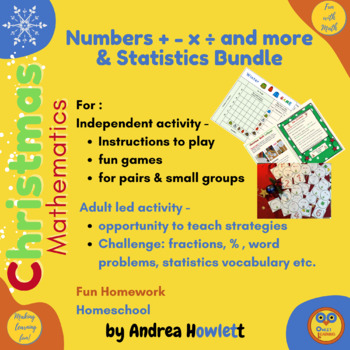
Christmas Statistics & Number Bundle
- Zip
Products in this Bundle (5)
Description
Statistics resources - the Christmas and winter resources will create fun for math games to learn about how to fill in a statistic graph such as a bar graph, tally chart and picture graph. The statistics table can then be used to interpret data and answer simple questions and students can also use this to make up their own challenging questions for example about the statistics range etc. The data generated - by using dice with cute clipart - will differ from one game to another, so will be relevant to this specific activity which makes it more interesting for children to play.
The number resources are based on numbers 1-12 and problem solving and are based on the popular traditional Christmas song, 'On the 1st day of Christmas....' but can also be used without referring to this. Children play games and make cute 3 dimensional Christmas baubles to give the classroom and home a festive cheer.
This will help your students by:
- learning about statistics in fun ways
- working out equivalent problems when making baubles e.g. 3 x 4 = 48 ÷ 4
- easy to tricky number calculations to choose from including simple counting to more tricky fractions and solving 1 step and 2 step word problems
- students can differentiate their statistics questions according to the mathematical vocabulary and concepts they know
- the competitive element will engage them
- resources can be used for individual games or played in pairs and small groups
- combining math/maths and crafts thereby getting creative students interested in maths/ math
This will help you by:
- having a fun game to play and at the same time assessing, discussing, clarifying and challenging students according to their ability
- having independent games - instructions are included
- this can be part of a math/ maths lesson or a fun afternoon of activities
- easy prep - print and provide simple resources - glue, scissors, pencils and play (hole puncher and string to make baubles)
- this can be stored easily in a zip bag including all necessary resources so that children have easy access e.g. they may choose this in free choosing time, wet play time etc. Having a number of games easily accessible makes math/ maths games and learning fun
- Fun homework
- Homeschool and home education
- resources in color/ colour and black and white for more printing options
- resources adapted to use Dyslexic font to help some students
- gives the classroom a winter/ Christmas feeling
- Great for Christmas but winter resources can also be used at other times
- blank resources for you and your students to create your own games and calculations for the 3D baubles. Differentiation - you can use these to generate easy or very challenging number problems for your students to solve or they can challenge their peers by making their calculations difficult
- both U.S. and U.K. spellings used
- can be printed onto letter size and A4 paper


