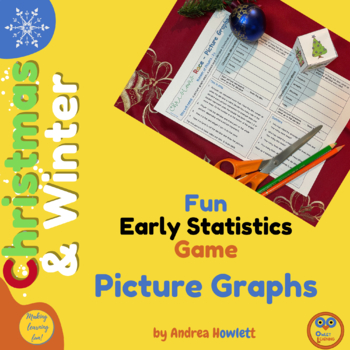
Christmas Fun Maths Games - Picture Graphs
Owlet Learning
178 Followers
Grade Levels
K - 3rd, Homeschool
Subjects
Resource Type
Standards
CCSSK.MD.A.2
CCSSK.MD.B.3
CCSS1.MD.C.4
CCSS2.MD.D.10
CCSS3.MD.B.3
Formats Included
- PDF
Pages
41 slides (9 themes)
Owlet Learning
178 Followers
Also included in
- Statistics resources - the Christmas and winter resources will create fun for math games to learn about how to fill in a statistic graph such as a bar graph, tally chart and picture graph. The statistics table can then be used to interpret data and answer simple questions and students can also usePrice $5.95Original Price $8.50Save $2.55
Description
What is pictogram or a picture graph? These resources will generate fun for math games and give students opportunities to create data, draw a statistics graph and then answer questions by using this information. They are encouraged to make up their own questions for their peers thereby learning how to interpret a statistics table and data collection.
This will help your students by:
- enjoying math/ maths
- being fun
- learning about picture graphs/ pictograms
- becoming more confident in understanding how simple data works
- interpreting picture graphs
- winter and Christmas theme
- engaging clip art to make this more appealing
- game for pairs or small groups
This will help you by:
- easy prep - print and provide simple resources such as glue, scissors and pencils
- instructions provided so this can be an independent activity
- a fun way to engage students with statistics for you to assess and explain any misconceptions during their game as an adult led activity
- can be part of a lesson on statistics
- fun homework
- homeschool/ home education
- leave this in a central math/ maths resource area for children to choose during free choosing time such as wet play time
- Christmas and winter theme
- color/ colour and black and white for more printing options
- dyslexic font for some games
This resource can be printed onto letter size and A4 size paper and uses both U.S. and U.K. spellings.
It goes well with my other Christmas / winter statistics games, the link is:
https://www.teacherspayteachers.com/Product/Christmas-Fun-Maths-Games-Bar-Graphs-Tally-Charts-7485588
I hope you enjoy this activity.
Total Pages
41 slides (9 themes)
Answer Key
N/A
Teaching Duration
N/A
Report this resource to TPT
Reported resources will be reviewed by our team. Report this resource to let us know if this resource violates TPT’s content guidelines.
Standards
to see state-specific standards (only available in the US).
CCSSK.MD.A.2
Directly compare two objects with a measurable attribute in common, to see which object has “more of”/“less of” the attribute, and describe the difference. For example, directly compare the heights of two children and describe one child as taller/shorter.
CCSSK.MD.B.3
Classify objects into given categories; count the numbers of objects in each category and sort the categories by count.
CCSS1.MD.C.4
Organize, represent, and interpret data with up to three categories; ask and answer questions about the total number of data points, how many in each category, and how many more or less are in one category than in another.
CCSS2.MD.D.10
Draw a picture graph and a bar graph (with single-unit scale) to represent a data set with up to four categories. Solve simple put-together, take-apart, and compare problems using information presented in a bar graph.
CCSS3.MD.B.3
Draw a scaled picture graph and a scaled bar graph to represent a data set with several categories. Solve one- and two-step “how many more” and “how many less” problems using information presented in scaled bar graphs. For example, draw a bar graph in which each square in the bar graph might represent 5 pets.


