3 results
2nd grade statistics Common Core K.MD.A.2 resources
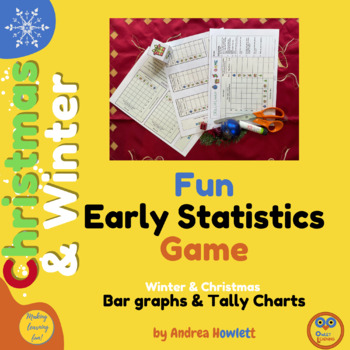
Christmas Fun Maths Games - Bar Graphs & Tally Charts
These Christmas resources will generate fun for math games and give students opportunities to create data, draw a statistics graph, such as a bar graph or tally chart, and answer questions by using this information. They are encouraged to make up their own questions for their peers thereby learning how to interpret a statistics table and data collection. The tally chart and bar graphs creator - the die or dice - has cute clipart to make this appealing to children. How will this help the students
Subjects:
Grades:
K - 3rd
Types:
Also included in: Christmas Statistics & Number Bundle
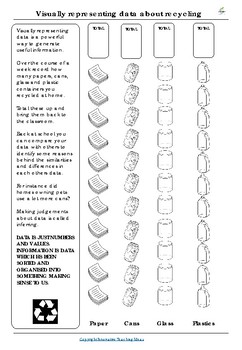
Data and Graphing Recycling Worksheet | Math | Statistics | Earth Day STEM
This worksheet allows students to graph and visually represent data about recycling. Statistics, Data analysis, and Graphing are Key MATH and STEM skills that can be completed independently as homework or in the classroom.THIS WORKSHEET IS ALSO PART OF A MUCH LARGER AND MORE AFFORDABLE BUNDLE HERE.YOU MIGHT ALSO ❤️ THESE ENGLISH RESOURCES❤️ Year-Long Visual Writing Prompts Collection❤️ News and Media Literacy Bundle❤️ 125 Guided Reading Activities for ANY BOOK❤️ HUGE Poetry Powerpack Unit❤️ Wr
Grades:
K - 3rd
Types:
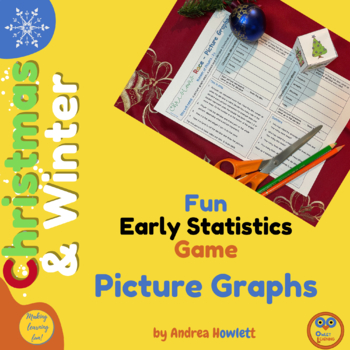
Christmas Fun Maths Games - Picture Graphs
What is pictogram or a picture graph? These resources will generate fun for math games and give students opportunities to create data, draw a statistics graph and then answer questions by using this information. They are encouraged to make up their own questions for their peers thereby learning how to interpret a statistics table and data collection. This will help your students by: enjoying math/ mathsbeing funlearning about picture graphs/ pictogramsbecoming more confident in understanding how
Subjects:
Grades:
K - 3rd
Types:
Also included in: Christmas Statistics & Number Bundle
Showing 1-3 of 3 results


