1,378 results
Statistics independent works for Microsoft Word
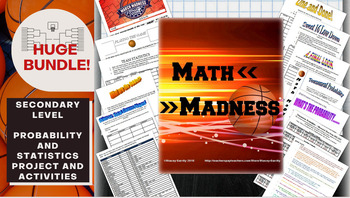
Math March Madness Full Tournament Project {BUNDLE}
Harness the excitement of NCAA March Madness with this huge project for secondary math teachers that follows all stages of the tournament! This Common Core aligned bundle comes with bonus parts not sold individually in my store so you can create a rich immersion in the tournament, practice probability and statistics and learn some interesting new ones along the way! Save $3 plus get bonus content by bundling!You can pick and choose which parts you would like to incorporate, or follow my schedu
Subjects:
Grades:
6th - 12th, Higher Education
Types:
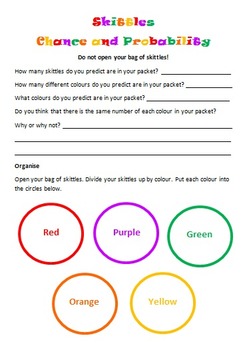
Skittles Chance and Probability (Editable)
Chance and Probability activity using yummy Skittles!!!
Students are to predict the colours and quantities before they open the skittles bag. Students are to complete a chance experiment where they use a tally to collect their data. Students then transfer their data in fractions, decimals and percentages. Students are to create a bar graph using their data as well as answer chance and probability questions about the data. I used this with my grade 5/6 students and they loved it!
Subjects:
Grades:
3rd - 10th
Types:
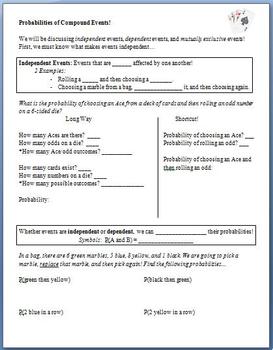
Probability of Compound Events (Guided Notes)
This lesson is meant to be used as guided notes for a whole class.
Students begin by learning what makes 2 events independent. After slowly working through a problem about rolling a die and choosing a card, they discover that they can multiply probabilities when working with these compound events. They then attempt problems involving picking marbles from a bag. Next, they learn about dependent events, and finally, mutually exclusive events.
The last 2 pages are a copy of the key.
Subjects:
Grades:
6th - 12th
Types:
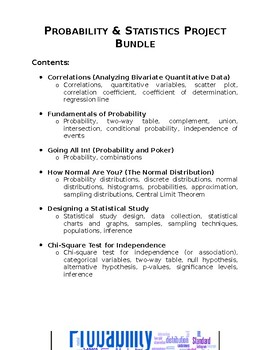
Probability & Statistics Project Bundle
A bundle that contains six different projects for a Probability & Statistics high school course. This bundle includes: Correlations (Analyzing Bivariate Quantitative Data) Fundamentals of Probability Going All In! (Probability, Combinations, and Poker) How Normal Are You? (The Normal Distribution) Designing a Statistical Study Chi-Square Test for Independence These projects are designed to engage students in authentic, hands-on, performance-based tasks. For each of these projects, students c
Subjects:
Grades:
9th - 12th
Types:
CCSS:
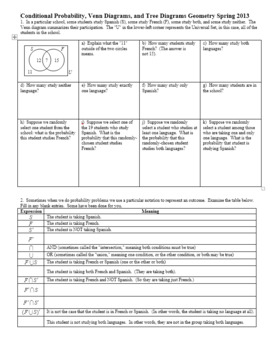
Conditional Probability and Tree Diagrams Geometry Spring 2013 w/ Key (Editable)
Once I've covered basic probability and statistical measures, I like to have students work with conditional probability, which can often go hand-in-hand with tree diagrams. I created this worksheet for my Geometry students, and I find that it is challenging for them, but it can be broken down into "baby steps" and they learn to navigate their way around a tree diagram to calculate conditional probabilities.
I use this activity within cooperative groups, and I circulate to make sure they are ge
Subjects:
Grades:
7th - 12th
Types:
Create a Line Plot Project
Looking to assess line plots? Look no further!This project incorporates learning targets, skills, collaboration, and technology.Directions: With a partner, create a question used to collect data from your classmates. (Examples: In inches, how long is your hand? In cm, what is the circumference of your head? etc.) Then, create a line plot with your results. Use fraction intervals.Requirements:Create a reasonable question (Teacher approval required)Collect at least 20 pieces of dataCreate a line p
Subjects:
Grades:
4th - 6th
Types:
CCSS:
Also included in: Upper Grade Math Projects
AP Statistics Football Binomial + Geometric Probability Project Digital + PDF
NEW for 2020! This resource now includes a fully editable Google Doc link for remote or distance learning! Assign the Google doc to your students, and they can type their answers directly into the boxes and submit their work digitally. This packet includes the following: Seven probability questions that use football quarterback pass completion rate, and require the use of the following probability techniques to answer: · Geometric PDF · Geometric CDF · Complement of Geometric CDF ·
Subjects:
Grades:
10th - 12th
Types:
Also included in: AP Statistics Project Bundle! 6 Projects + digital versions
Cards Probability Scavenger Hunt Activity
A mix of 26 addition rule, multiplication rule, and conditional probability questions about a standard deck of cards. Find the cards in question to lead you to the next problem! This resource is a word document so you may edit it to your liking. I made this activity for my CP Probability&Statistics class - but it is also challenging enough for an AP level statistics class. It generally takes about two class periods - but my kids LOVE it and it is GOOD practice. The problems may be a little t
Subjects:
Grades:
9th - 12th, Higher Education
Types:
Create Your Own Statistics Project
This document contains a statistics project description that allows students to create their own project. This is suitable for high school and beginning level college statistics class. Students will design their own study - formulate research questions, collect data, organize and summarize the findings, calculate confidence interval and construct hypothesis testing. Certain restrictions are outlined in the document. Students will experience the complexity of constructing their own study. They ar
Subjects:
Grades:
10th - 12th, Higher Education, Adult Education
Types:

Safe Cracker - Mean, Median, Mode, & Outliers - Math Fun!
Do your students get excited when you tell them it's time to study outliers and measures of center? Of course they don't.
But they will if you use this fun, Safe Cracker worksheet!
Students can become world famous safe crackers! Your students will use the clues and their math skills to help crack the safes, in order to claim the prizes found inside.
Students are given three "clues", which involve outliers and measures of center (mean, median, and mode). The answers become the numbers in the
Subjects:
Grades:
5th - 8th
Types:
CCSS:
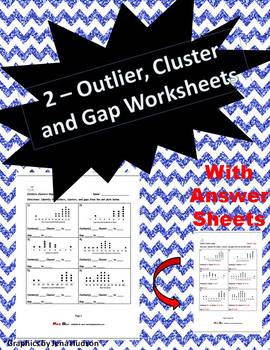
Outliers Clusters Gaps Worksheets (Two Worksheets)
Included are 2 worksheets in which students look at dot plots and line plots in order to find outliers, clusters and gaps. Also included are teacher answer sheets.
**This activity is included in a larger bundle (see link below)
https://www.teacherspayteachers.com/Product/Statistics-Unit-3505315
Subjects:
Grades:
5th - 7th
Types:
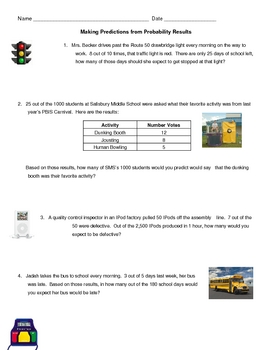
Probability ~ Making Predictions
On this two page worksheet plus answer key, students are asked to use the results of either a survey or experiment to make predictions. Students could use percents or proportions in order to solve these real world problems. Please see demo for types of problems.
Subjects:
Grades:
6th - 8th
Types:
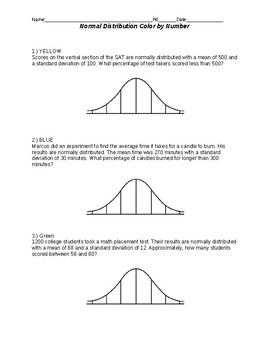
Color by Numbers Normal Distribution
These problems are very straight forward Normal Distribution problems using the Empirical Rule 68-95-99.7 My students enjoyed these. All pages are editable so make it your own, switch out colors and or scenarios.
Subjects:
Grades:
10th - 12th
Types:
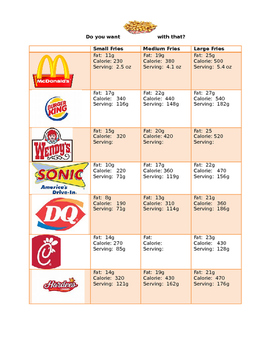
French Fry Scatter Plot & Best Line of Fit
Students will compare the nutritional values and serving sizes of french fries from various fast food restaurants. Based on this information, they will create scatter plots, best lines of fit and the equation of the trend line. Using the equation, they will estimate the unknown values of kid meals and supersized portions of french fries.
Subjects:
Grades:
8th - 11th
Types:
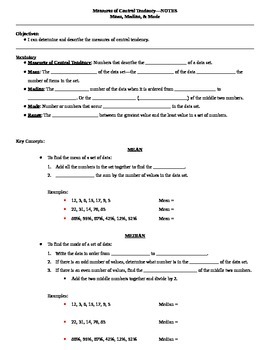
Measures of Central Tendency Guided Notes
These are guided notes for a lesson on measures of central tendency including mean, median, mode, and range. There are several examples in the notes and the same data sets are used to show each measure of central tendency.I have also included a teacher key to show you what to fill in the blanks as your students follow along.To use these notes, I simply projected them onto my whiteboard, gave the students their blank copies, and had them follow along and write what I wrote. This works great when
Subjects:
Grades:
5th - 12th
CCSS:
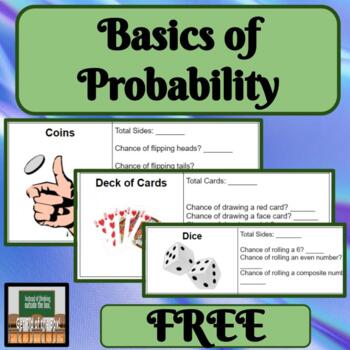
Basics of Probability Dice Cards Coins
About this Resource:Many students do not know all that is needed about dice, coins, and decks of cards. In order to be successful, it is important to cover all of this information first. Topic Covered:*Probability Ways to use this product in your classroom:-whole class-exploration-hands-on-small group-independent Other products with similar content.M&M's ProbabilityBox Plots with WeatherVisuals with Measures of Central TendencyCreating Line Plots
Subjects:
Grades:
6th - 9th
Types:
Also included in: Probability Bundle Hands On Dice Cards Coins Simple Probability
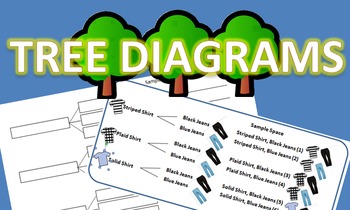
Tree Diagrams Notes and Practice Packet
I created this packet on tree diagrams for my probability unit so that students could work with one another to learn how to create a tree diagram on their own without my direct instruction. This gave me the freedom to help students that needed more individualized instruction and guidance. This packet was great to use before introducing the fundamental counting principle.
Subjects:
Grades:
4th - 9th
Types:
Misleading Charts and Graphs Analysis
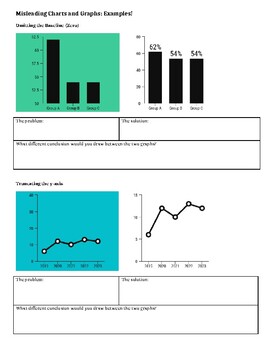
This lesson outlines the four most common ways that writers and journalists display graphs that can cause people to draw incorrect conclusions. Students look at examples of bad graphs along with corrected versions and explain why one version is misleading and the other is correct. Independent practice is provided for the students to demonstrate understanding as well.
Subjects:
Grades:
Not Grade Specific
Types:
Rich Dad Poor Dad - ENTIRE UNIT (39 PAGES)!!!!!
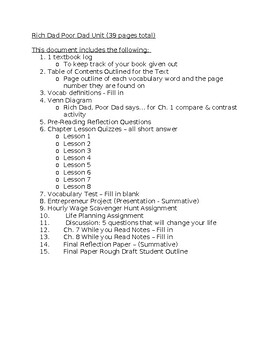
The following is an ENTIRE UNIT for the book Rich Dad Poor Dad. It is a WORD DOC so you can edit it to your liking!This ENTIRE UNIT includes the following:1. 1 textbook log o To keep track of your book given out2. Table of Contents Outlined for the Texto Page outline of each vocabulary word and the page number they are found on3. Vocab definitions - Fill in4. Venn Diagram o Rich Dad, Poor Dad says… for Ch. 1 compare & contrast activity5. Pre-Reading Reflection Questions6. Chapter Lesson Quiz
Subjects:
Grades:
9th - 12th, Higher Education
Types:
Carnival Probability Project
A project that feels like a game!
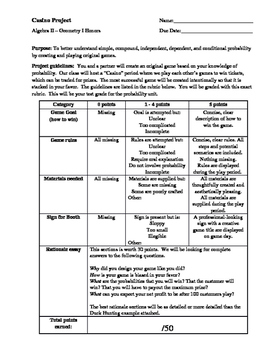
Students must create their own game, using probability to ensure THEY are favored to win....much like the house in a casino. Students can make games involving dice, spinners, cards, "fishing" ducks out of a pond, etc.
Assessed skills include: fundamental counting principal, theoretical probability, experimental probability, independent events, dependent events, creativity, writing, presentation. *Students must already know basic probability to complete this
Subjects:
Grades:
8th - 12th
Types:
Adjustable Graph Templates
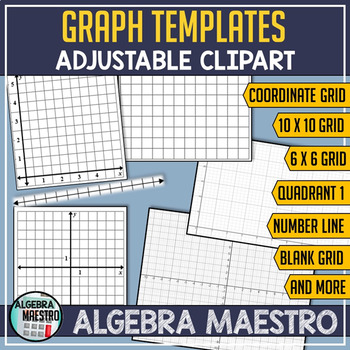
With Adjustable Graph Templates you'll receive a variety of graphs that are formatted to be easily adjustable, this is to help you create your own assignments. The full-page templates can be used as cut-outs, very useful for Foldables, and Interactive Notebooks. There are a variety of graph templates: coordinate axis (axes), 1st quadrant, number line, grid - and with a variety of units and sizes to suit your needs. To adjust a graph - click the desired graph and adjust the size by selecting-
Subjects:
Grades:
Not Grade Specific
Types:
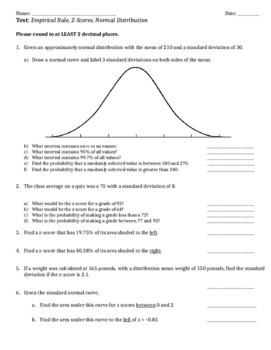
Emprical Rule, Z-Scores, Normal Distribution Assessment/Review
This product can be used as a review or assessment for the empirical rule, z-scores and standard deviation, and the normal distribution. This is meant for a regular Statistics class, not AP. Can also be used for the Algebra II unit on Statistics.
Subjects:
Grades:
10th - 12th
Types:
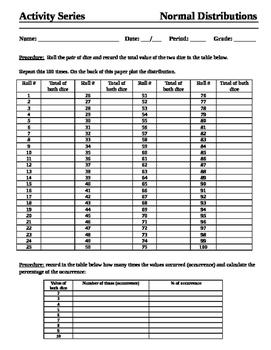
Normal Distributions - Activity Series
This activity sheet helps students better understand normal distributions through the use of dice. Each student rolls a pair of dice and adds the total of each dice and records it 100 times. Then they plot the distribution and in most cases it comes out a bell curve. Its a fun and easy way to show the distribution. You could pair students up for less dice usage.
Subjects:
Grades:
10th - 12th
Types:
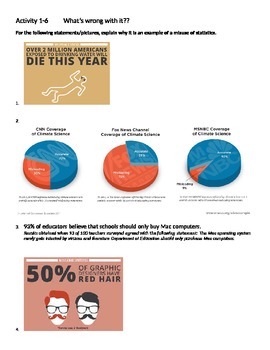
1-6 Misleading Statistics Worksheet
Students are asked to give a reason why each statistic is misleading. This accompanies Bluman's Elementary Statistic Book, section 1-6.
The worksheet has two pages, and answers are attached.
**There is a PowerPoint to accompany the worksheet for class discussion.
Subjects:
Grades:
9th - 12th
Types:
Showing 1-24 of 1,378 results


