12 results
Statistics independent works for SMART Notebook
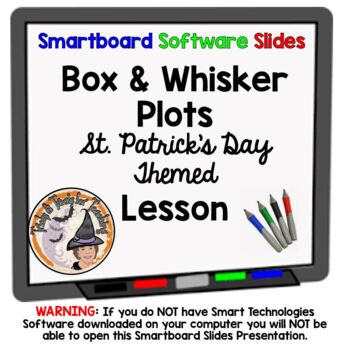
Box and Whisker Plots Smartboard Slides Lesson St. Patrick's Day Theme
This Box and Whisker Plots Smartboard Lesson teaches students how to create a Box Plot step by step. LOTS of practice in creating and reading Box and Whisker Plots, along with an Interactive QUIZ on Box Plots. These slides have a St. Patrick's Day clipart theme. In case you don't want that, I also have the SAME Box and Whisker Plots Smartboard Lesson on everyday math slides as well. https://www.teacherspayteachers.com/Product/Box-and-Whisker-Plots-Smartboard-Lesson-Step-by-Step-How-to-Constuct-
Subjects:
Grades:
5th - 7th
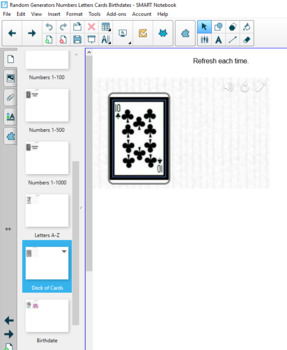
Random Number Letter Deck of Cards Birthday Generator SMART 18 Flash Replacement
If your district has upgraded to Windows 10 and SMART 18, then many of your highly-used flash components will no longer work. I have been recreating them in the new SMART 18. These Random Generators (Numbers 1-36, Numbers 1-100, Numbers 1-500, Numbers 1-1000, Letters A-Z, Playing Card from a Deck of Cards, & Birthdate) are comparable to what was previously available in SMART, though they operate differently.Random Generators SMART 18 Flash Replacement by Brian Tillmann is licensed under a Cr
Subjects:
Grades:
K - 12th, Staff
Types:

Using Models to Represent Ratios and Rates! SmartBoard Lesson / Scaffold Notes
In this SmartBoard lesson, students will learn how number lines, charts, tables and graphs can be used to represent unit rates, rates and ratios. Students will be given examples of how ratios are placed in tables/charts to see relationships and solve for unknowns. Students will see how double number lines are also used to represent rates and ratios. Lastly, students will see how line graphs, using x and y along with points can represent ratios and rates. There are examples of each for the class
Subjects:
Grades:
5th - 7th
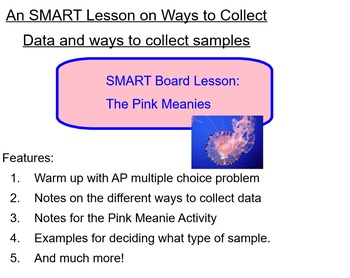
Statistics (SMART Board): Pink Meanies (Ways to Collect Samples)
This SMART lesson includes the following:
- A warm up with an AP multiple choice question
- Notes on different ways to collect data
- An activity on a census
- Notes for the Pink Meanie Investigative Task
- Examples of different types of sampling methods
- A closing the includes a card sort for the different types of sampling methods.
Subjects:
Grades:
11th - 12th, Higher Education
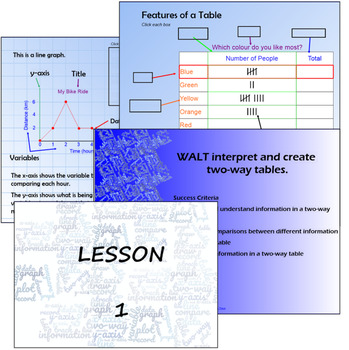
Data Lesson Sequence - 4 Lessons - Data/Statistics - KS2/Stage 3
Data lessons on tables, two-way tables and line graphs presented in Smart Notebook. It includes 4 lesson presentations including WALTs and Success Criteria in the slides, all ready to be used with your class. It gives some basics for a unit of work on data and it is fully editable. The aim of these lessons is to break down each data collection/displaying method into simple language so that it is easy to follow.Lesson 1 - Simple Data Tables. This goes through the features of a table and practice
Subjects:
Grades:
4th - 7th

1.1 Inferential and Descriptive Statistics
Smart Board Lesson for Bluman "Elementary Statistics) 8th edition
Subjects:
Grades:
9th - 12th
Types:

Always, Sometimes, Never Sets Smart Notebook
This is a SmartNotebook document for notes on Always, Sometimes, Never Sets. It is editable.
Subjects:
Grades:
7th - 11th

CaHSEE Data Stats and Probability
Works through CaHSEE standards for Data, Statistics and Probability. Finding Mean, Median, and Mode. Working with dependent and independent probabilities. Guided and Independent practice included.
Subjects:
Grades:
8th - 11th
Types:

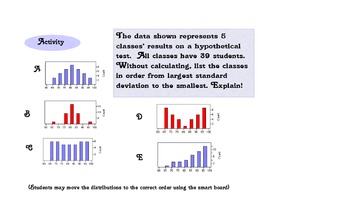
Mean Absolute Deviation Lesson
This is a smartboard lesson on how to calculate the mean absolute deviation. The lesson is currently filled in, which you can erase, and has examples as well as bell work.
Subjects:
Grades:
6th - 9th

1.2-1.4 Data Sampling and Techniques
Smart Board Lesson for Bluman "Elementary Statistics" 8th edition
Subjects:
Grades:
9th - 12th
Types:
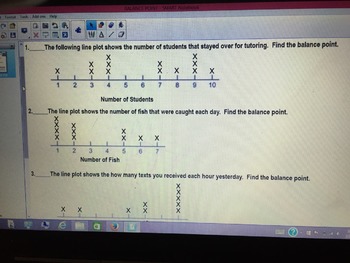
MEAN AS BALANCE POINT & MEAN, MEDIAN, & MODE REVIEW
Brief exercise related to the 6th grade concept (Virginia)of mean as balance point, with some problems related to mean, median, and mode.
Subjects:
Grades:
6th
Types:
Showing 1-12 of 12 results


