68 results
Statistics independent work interactive whiteboards
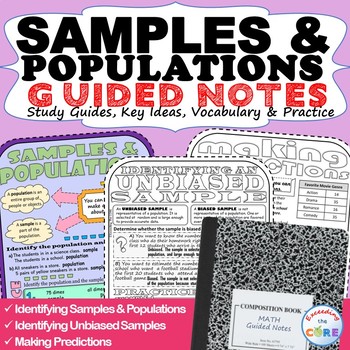
SAMPLES & POPULATIONS Doodle Math - Interactive Notebooks (Guided Notes)
- Great for online learning and distance learning!Have your students use these SAMPLES & POPULATIONS Guided Notes to review key ideas and essential vocabulary . Guided Notes aid in student focus, concept retention, engagement and creativity. Using this resource will allow students to synthesize this math concept and create their own tangible connections in their notes. Guided Notes Includes:__ Key Ideas with Verbal & Numerical Examples__ Essential Vocabulary with Definitions__ Skills Pr
Subjects:
Grades:
6th - 8th
Also included in: 7th GRADE MATH Assessments, Warm-Ups, Task Cards, Worksheets BUNDLE
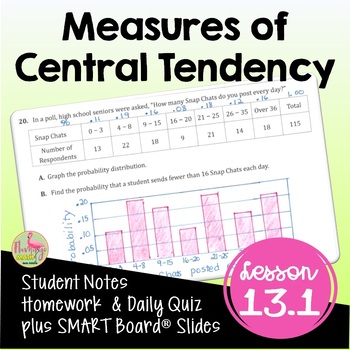
Measures of Central Tendency (Algebra 2 - Unit 13)
Measures of Central Tendency Algebra 2 Lesson:Your Pre-AP Algebra 2 Honors students will draw, analyze and interpret box-and-whisker plots, find outliers, and calculate measures of central tendency in this unit 13 lesson on Data Analysis & Statistics that cover the concepts in depth. #distancelearningtptWhat is included in this resource?⭐ Guided Student Notes⭐ Google Slides®⭐ Fully-editable SMART Board® Slides⭐ Homework/Practice assignment⭐ Lesson Warm-Up (or exit ticket)⭐Daily Content Quiz
Subjects:
Grades:
8th - 11th, Higher Education
CCSS:
Also included in: Algebra 2 Curriculum Mega Bundle | Flamingo Math
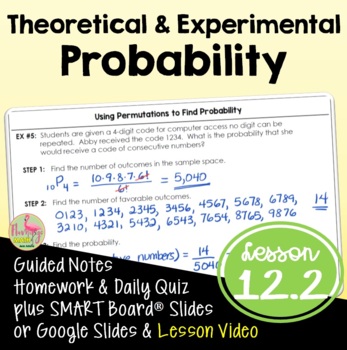
Theoretical and Experimental Probability (Algebra 2 - Unit 12)
Theoretical & Experimental Probability Algebra 2 Lesson:Your Pre-AP Algebra 2 Honors students will find both experimental and theoretical probabilities in this Unit 12 lesson. #distancelearningtptWhat is included in this resource?⭐ Guided Student Notes⭐ Google Slides®⭐ Fully-editable SMART Board® Slides⭐ Homework/Practice assignment⭐ Lesson Warm-Up (or exit ticket)⭐ Daily Content Quiz (homework check)⭐ Video Lesson Link for Distance Learning - Flipped Classroom models⭐ Full solution setStude
Subjects:
Grades:
8th - 11th, Higher Education
CCSS:
Also included in: Algebra 2 Curriculum Mega Bundle | Flamingo Math
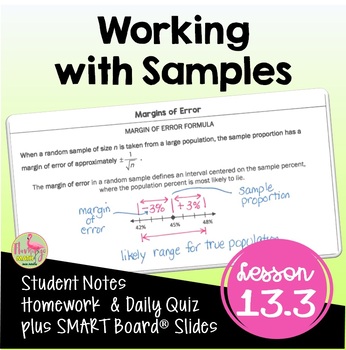
Working with Samples (Algebra 2 - Unit 13)
Working with Samples Algebra 2 Lesson:Your Pre-AP Algebra 2 Honors students will find draw, analyze and interpret box-and-whisker plots, find outliers, and calculate measures of central tendency in this unit 13 lesson on Data Analysis & Statistics that cover the concepts in depth. #distancelearningtptWhat is included in this resource?⭐ Guided Student Notes⭐ Google Slides®⭐ Fully-editable SMART Board® Slides⭐ Homework/Practice assignment⭐ Lesson Warm-Up (or exit ticket)⭐Daily Content Quiz (ho
Subjects:
Grades:
8th - 11th, Higher Education
CCSS:
Also included in: Algebra 2 Curriculum Mega Bundle | Flamingo Math
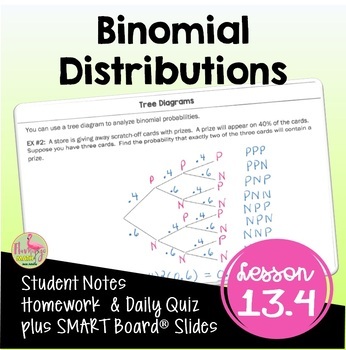
Binomial Distributions (Algebra 2 - Unit 13)
Binomial Distributions Algebra 2 Lesson:Your Pre-AP Algebra 2 Honors students will calculate measures of central tendency, draw, analyze, and interpret box-and-whisker plots and find outliers using binomial distributions in this Unit 13 lesson. #distancelearningtptWhat is included in this resource?⭐ Guided Student Notes⭐ Google Slides®⭐ Fully-editable SMART Board® Slides⭐ Homework/Practice assignment⭐ Lesson Warm-Up (or exit ticket)⭐ Daily Content Quiz (homework check)⭐ Video Lesson Link for Dis
Subjects:
Grades:
8th - 11th, Higher Education
CCSS:
Also included in: Algebra 2 Curriculum Mega Bundle | Flamingo Math
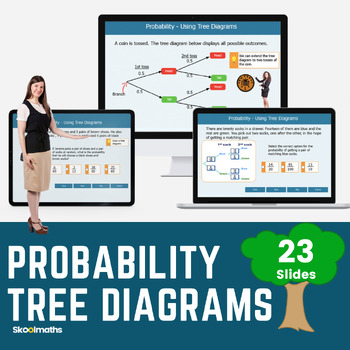
Probability Tree Diagrams Interactive Digital Resources CCSS.7.SP.C.5
Probability Tree Diagrams Interactive Lesson and Activities CCSS.7.SP.C.5Engage your middle school math class with this amazing interactive lesson plan which is focused on teaching probability tree diagrams, aligned with the Common Core State Standard 7.SPC.5. It includes self-marking activities and instructions designed to help middle school students understand and apply the concept of probability through tree diagrams. The interactive elements involve hands-on activities, digital simulations,
Subjects:
Grades:
7th - 8th
Also included in: High School Statistics and Probability Bundle
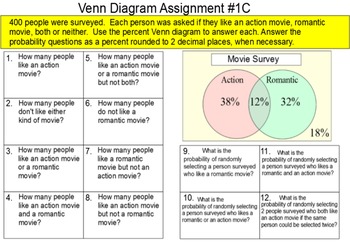
Venn Diagrams with Probability, 2 Lessons + 16 Assignments for SMART
Included in this zip folder are 19 SMART Notebook files. 2 are for instruction, 1 is a student reference handout and 13 are assignments. A brief description of each:
Instruction file #1 is a 36 slide introduction to reading a Venn diagram. Some formative assessment problems are included.
Instruction file #2 is a 25 slide introduction to the complement of a set in a Venn diagram.
Assignment A is a matching assignment. The student matches 10 2 circle Venn diagrams with union, intersection and
Subjects:
Grades:
8th - 11th
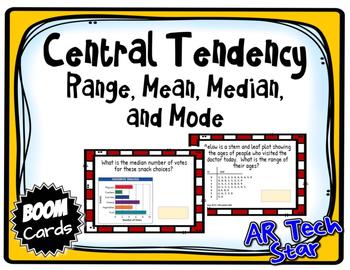
Central Tendency - Range, Mean, Medan, and Mode Boom Cards Distance Learning
This set of 20 interactive, digital task cards is designed to provide practice of measures of central tendency - range, mean, median, and mode. The first five cards address a poem to help students remember the measures of central tendency, and vocabulary questions in multiple choice format. The remaining cards are word problems with data given in stem and leaf plots, dot plots, bar graphs, data sets, and data tables where students will respond by typing in answers. We love Boom Cards and my k
Subjects:
Grades:
5th - 7th
Also included in: Math Boom Card Bundle Gr 3-6 - Distance Learning
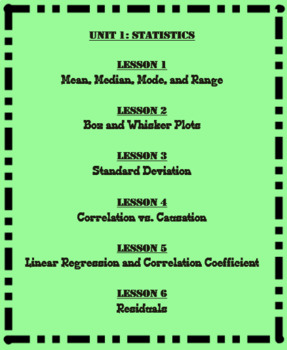
Unit 1-Statistics (Math 1)
This is the first Unit of the eight Units that I cover in Math 1. This unit is broken up in to six different lessons that are listed below. Each lesson includes a SMART Notebook presentation, a student note-taking guide, and an answer key. Also included in this unit are student flashcards, a test outline, and a 25 question multiple choice test.
Unit 1: Statistics
Lesson 1: Mean Median Mode Range Outliers and Skew
Lesson 2: Box and Whisker Plots
Lesson 3: Standard Deviation
Lesson 4: Correlati
Subjects:
Grades:
6th - 12th
CCSS:
Open-Ended Math Questions - Chance and Data
This product targets chance, data, graphing and probability by asking the students open ended questions about the topic. This provides an entry point for all students and allows the teacher to quickly gauge the varying levels of knowledge and understanding in the classroom. The PDF is intended to be displayed on an interactive whiteboard and students could answer the questions orally, on mini whiteboards or on the included student response sheet. The student response sheet could also be used as
Subjects:
Grades:
3rd - 5th
Also included in: Open Ended Math Questions BUNDLE - Over 65 Different Questions!
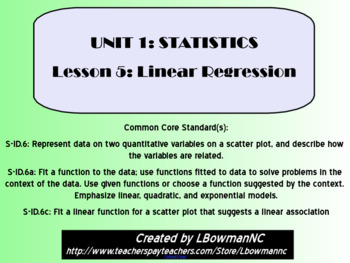
Linear Regression and the Correlation Coefficient (Math 1)
This lesson is the fifth of six lessons in the Math 1 Statistics Unit.
This lesson includes important vocabulary, examples (guided practice), and class work (independent practice). At the end of the presentation is a Ticket Out the Door that can be used as a formative assessment.
There is a note-taking guide for the students to fill out as the teacher goes through a SMART Notebook presentation.
Unit 1: Statistics
Lesson 1: Mean Median Mode Range Outliers and Skew
Lesson 2: Box and Whisker
Subjects:
Grades:
6th - 12th
CCSS:
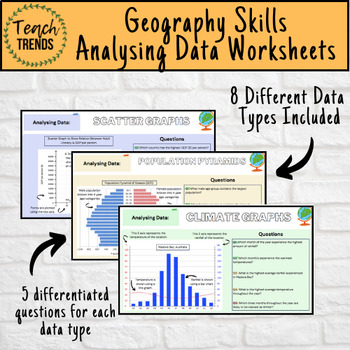
Geography Data Analysis Skills Work Booklet / Activities
Enhance your pupils’ geographical skills with a series of interpretation and analysis sheets and questions. This resource includes 8 PDF slides with corresponding questions all focused on a different data presentation method. Ideal for preparing your pupils for exams and revising analysis skills. The high quality slides include annotations, examples and five scaled-ability questions.The data presentation skills included in this resource are:Climate GraphsPopulation PyramidsChoropleth MapsScatter
Subjects:
Grades:
8th - 12th, Adult Education
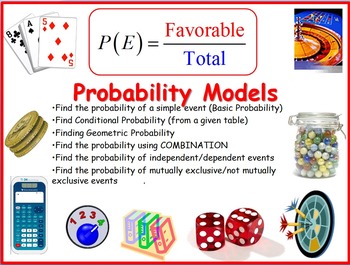
Probability Models
This handout drills the understanding of the different models of probability. Student would have to first determine under which model should this problem fit, then, apply the appropriate strategy to answer the questions. There are many ways to answer each of the questions provided in this handout. I provided "An" answer key.
In this handout, you will find a set of 40 questions on the following probability models:
1. Detailed visual description of the Standard Deck of Cards
2. Basic Probab
Subjects:
Grades:
6th - 12th, Higher Education, Adult Education, Staff
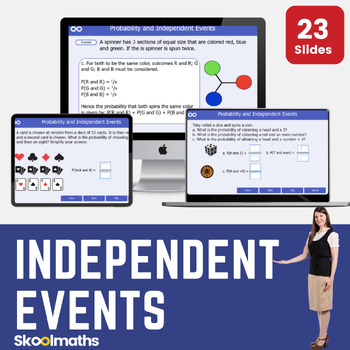
Probabilities | Independent Events Interactive Digital Lesson and Activities
Probabilities | Independent EventsIndependent events are those events whose occurrence is not dependent on any other event. Teach your learners to understand this important concept in statistics and probability with our amazing interactive probability lesson that will teach your Middle school class how to determine the independence of events and how to apply the rule of product to calculate probabilities.By the end of this unit, learners will be able to:Understand the concept of probability and
Subjects:
Grades:
7th - 8th
Also included in: High School Statistics and Probability Bundle
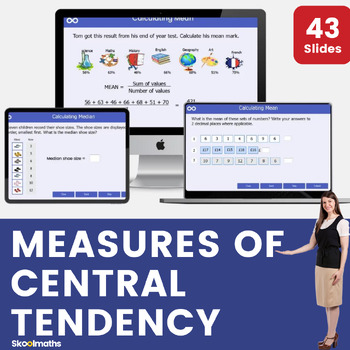
Measures of Center - Mean, Median, Mode and Range Interactive Math Lesson
Measures of Center - Mean, Median, Mode and Range Interactive Math LessonA completely interactive Middle school lesson for pupils in 6th grade on calculating averages. In this lesson, learners are able tocalculate measures of central tendency (mean, median, and mode);calculate measures of dispersion (range)understand interpretation and applicability of these measuresapply appropriate use of measures to compare data.The lesson can be used as whole class teaching by teachers and at home by learner
Subjects:
Grades:
6th - 7th
Also included in: Complete Statistics and Probability Bundle | Digital and Print
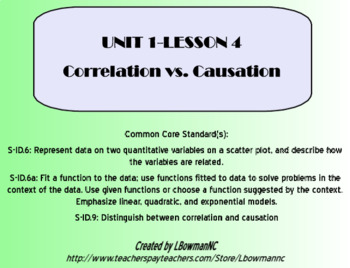
Correlation vs Causation (Math 1)
This lesson is the fourth of six lessons in the Math 1 Statistics Unit.
This lesson includes important vocabulary, examples (guided practice), and class work (independent practice). At the end of the presentation is a Ticket Out the Door for the students.
There is a note-taking guide for the students to fill out as the teacher goes through a SMART Notebook presentation.
Unit 1: Statistics
Lesson 1: Mean Median Mode Range Outliers and Skew
Lesson 2: Box and Whisker Plots
Lesson 3: Standard
Subjects:
Grades:
6th - 12th
CCSS:
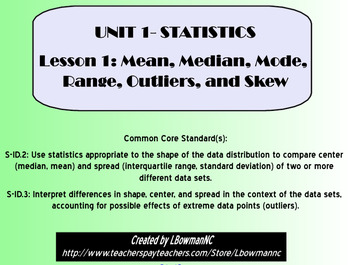
Mean Median Mode Range Outliers and Skew (Math 1)
This lesson is the first of six lessons in the Math 1 Statistics Unit.
This lesson includes important vocabulary, examples (guided practice), and class work (independent practice). The examples and class work are broken up in to two separate "chunks". This allows the students to establish a foundation for the topics covered before moving on to more challenging problems. At the end of the presentation is a Ticket Out the Door that can be used as a formative assessment.
There is a note-taking g
Subjects:
Grades:
6th - 12th
CCSS:
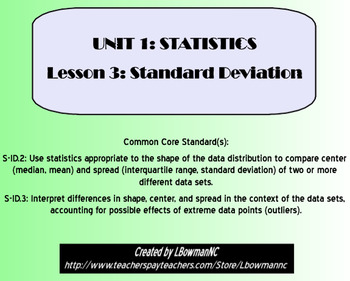
Standard Deviation (Math 1)
This lesson is the third of six lessons in the Math 1 Statistics Unit.
This lesson includes important vocabulary, examples (guided practice), and class work (independent practice). The examples and class work are broken up in to two separate "chunks". The first chunk requires the students to calculate the standard deviation by hand. The second chunk requires the students to find the standard deviation using a graphing calculator and then to use standard deviation to compare different sets of d
Subjects:
Grades:
6th - 12th
CCSS:
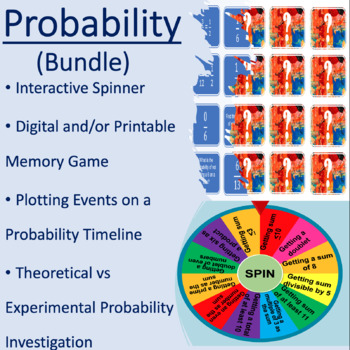
Probability:Interactive Games,Events on Number line,Theoretical and Experimental
By purchasing this bundle, you will save 10% off the individual resources! Plotting events on a probability timeline and relating fractions to likelihood:This product includes:+ Plotting events on a probability timeline (Three versions include: Interactive PowerPointä, Cut and paste, and Draw a Line)+ Fun and interactive matching memory game for probability (chances of events happening)+ Printable matching memory game for probability + Post-test (probability reflection questions) Investigate the
Subjects:
Grades:
5th - 6th
Grade 2 Data and Statistics
This is a COMPLETE resource pack (up to 10 lessons) for teaching Grade 2 Data and Statistics objectives. Included is differentiated worksheets (28 pages) to teach tables, diagrams (Carroll and Venn), pictograms and bar charts (in Word and PDF format - the Word versions can of course be edited if necessary) and answer sheets. In addition there is a 50 page flipchart (ActivInspire, PowerPoint and PDF format) to help deliver and teach the lessons. Also included is a planning tool, so you’ll simply
Subjects:
Grades:
2nd
CCSS:
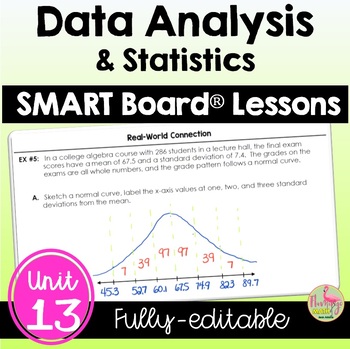
Data Analysis and Statistics SMART Board® Lessons (Algebra 2 - Unit 13)
Data Analysis & Statistics SMART Board Bundle:This bundle of SMART Board® presentations for Algebra 2 Honors students covers Unit 13: DATA ANALYSIS & STATISTICS. You have total freedom to alter and revise each fully-editable SMART Notebook® file. Then, you can teach and present your lesson with any compatible Interactive Whiteboard. There are 108 slides to cover the concepts in depth.The unit includes the following topics:1) Measures of Central Tendency2) Analyzing Data3) Working With S
Subjects:
Grades:
8th - 11th, Higher Education
CCSS:
Residuals (Math 1)
This lesson is the last of six lessons in the Math 1 Statistics Unit.
This lesson includes important vocabulary, examples (guided practice), and class work (independent practice) on how to find the residual values for a linear regression model. At the end of the presentation is a Ticket Out the Door for the students.
There is a note-taking guide for the students to fill out as the teacher goes through a SMART Notebook presentation.
Unit 1: Statistics
Lesson 1: Mean Median Mode Range Outli
Subjects:
Grades:
6th - 12th
CCSS:
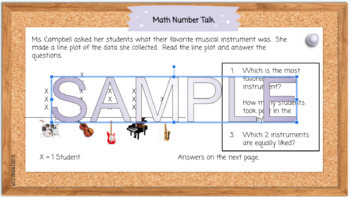
Line Plot Number Talks: Probability and Statistics
Number Talks are a great way to facilitate student interaction in all units of mathematics. Excellently crafted to review skills and review / practice questions. Includes slides for discussion of strategies and all answers provided! The following VA Standards of Learning are met in these slides: 5.15 The student will determine the probability of an outcome by constructing a sample space or using the Fundamental (Basic) Counting Principle. 5. 16 The student, given a practical problem, will a)
Subjects:
Grades:
4th - 6th
Statistical Questions Activity Manual - 6.SP.1
Discover the difference between "statistical" questions and other questions. Scaffolded lesson provides for classroom differentiation. Can be used as a lesson leader, guided practice, independent practice, for cooperative learning and math centers, or as an assessment. Use with smartboard, projector, computer, pad or as printable. Lesson is complete - NO PREP.
Objectives:
- Identify statistical questions
- Write statistical questions
- Answer statistical questions
Includes 6 problem pages and an
Subjects:
Grades:
5th - 8th
CCSS:
Showing 1-24 of 68 results


