22 results
Statistics activities for SMART Notebook
Histograms Smartboard Lesson Data Displays Graphs Graphing
TERRIFIC Histograms-Smartboard-Slides-Lesson covers what a Histogram is, what they look like, features specific to Histograms, and lots of interactive practice for students to create Histograms and be able to read Histograms and find answers. This smartboard lesson also combines activities to practice Histograms. Your students will LOVE learning about Histograms with this Smartboard Lesson. You'll use this year after year to teach Histograms. Created by Tricks and Treats for Teaching. WARNING: Y
Subjects:
Grades:
4th - 6th
Categorical Data Smartboard Slides Lesson Displaying Analyzing Organizing
Categorical-Data Math Smartboard-Slides-Lesson covers the TEKS for 6th grade Math specific to this skill. Lots of great examples and teaching, along with interactive practice for your students. You'll LOVE this resource and use it year after year! WARNING: You MUST have SMART Technologies SMART software, and a SMARTBOARD to teach from, to effectively download, open and use this Interactive Smartboard Lesson. Go to https://legacy.smarttech.com/en/products/education-software/smart-learning-suite/
Subjects:
Grades:
5th - 8th
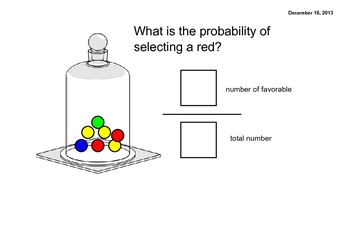
Probability Smartlesson
This activity is designed to be the initial lesson when introducing the vocabulary associated with probability. It allows students to practice matching outcomes with vocabluary terms, and also leads to how to express probability using a fraction. Each slide is interactive and will encourage great conversations full of academic vocabulary!
Subjects:
Grades:
4th - 6th
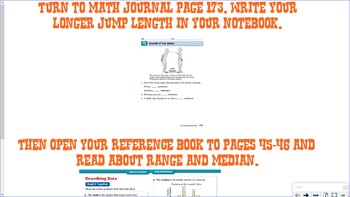
Everyday Math Second Grade Lesson 7.7
This SmartBoard file includes everything you need to teach lesson 7.7 of Everyday Math for second grade! It begins with a math message slide and a slide stating the objective(s) of the lesson in child-friendly terms. Then, there are practice slides for the students to interact with for each aspect of the lesson. All associated math journal pages are on their own slides. This is a great way to guide the class (and/or a sub!) through the lesson, and allow maximum participation and enrichment.Lesso
Subjects:
Grades:
2nd
Also included in: Everyday Math Second Grade Unit 7 Daily SmartBoard Slides Bundle
Everyday Math Second Grade Lesson 12.7
This SmartBoard file includes everything you need to teach lesson 12.7 of Everyday Math for second grade! It begins with a math message slide and a slide stating the objective(s) of the lesson in child-friendly terms. Then, there are practice slides for the students to interact with for each aspect of the lesson. All associated math journal pages are on their own slides. This is a great way to guide the class (and/or a sub!) through the lesson, and allow maximum participation and enrichment.Less
Subjects:
Grades:
2nd
Also included in: Everyday Math Second Grade Unit 12 Daily SmartBoard Slides Bundle
Everyday Math Second Grade Lesson 7.8
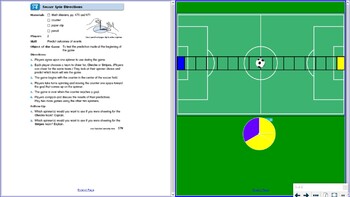
This SmartBoard file includes everything you need to teach lesson 7.8 of Everyday Math for second grade! It begins with a math message slide and a slide stating the objective(s) of the lesson in child-friendly terms. All associated math journal pages are on their own slides. There is a soccer game board to help students practice Soccer Spin before having them play on their own. This is a great way to guide the class (and/or a sub!) through the lesson, and allow maximum participation and enrichme
Subjects:
Grades:
2nd
Also included in: Everyday Math Second Grade Unit 7 Daily SmartBoard Slides Bundle
Exploring Graphs and Charts
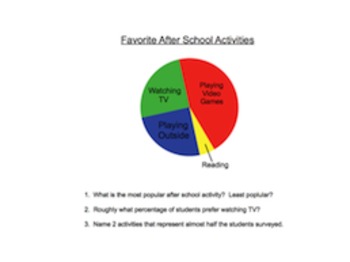
This is a great introductory lesson on different ways of displaying data and how to interpret data. Explore Pie Charts/Circle Graphs, Bar Graphs, Line Graphs, and Pictographs. Each has an explanation and sample graph with questions to check for students' ability to interpret data. This lesson uses lots of bold colors and pictures that are sure to grab your students' attention!
Subjects:
Grades:
5th - 7th

Math SMARTboard Lesson: Probability Predict an Outcome
This smart board lesson was created to guide my instruction with my 3rd graders on how to predict an outcome using probability. Included in this lesson is an essential question, lots of interactive student practice, and a total of 8 slides.
Subjects:
Grades:
2nd - 5th
SMARTBOARD lesson on ratios, fractions, percentages, and more
This smartboard lesson showcases how ratios, fractions, decimals, probabilities, and percentages are all similar ways of looking at the same thing. Each page has a spinner with a different amount of colored slices on it. As you go from many slices to fewer slices, the chance of correctly predicting what color comes up gets much better.
Have students 'bet' classroom rewards like tickets or candy to see who can correctly guess the most colors as you go through the lesson.
Subjects:
Grades:
3rd - 12th, Adult Education
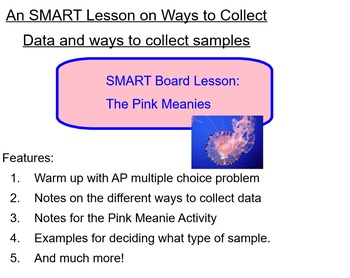
Statistics (SMART Board): Pink Meanies (Ways to Collect Samples)
This SMART lesson includes the following:
- A warm up with an AP multiple choice question
- Notes on different ways to collect data
- An activity on a census
- Notes for the Pink Meanie Investigative Task
- Examples of different types of sampling methods
- A closing the includes a card sort for the different types of sampling methods.
Subjects:
Grades:
11th - 12th, Higher Education
Ratios Smart Notebook
This is a smart notebook presentation introducing and discussing ratios.
Subjects:
Grades:
4th - 6th
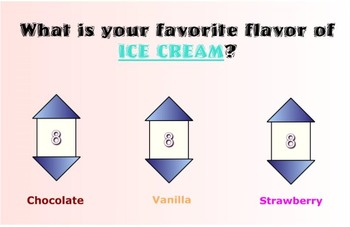
Tally Chart Smartboard Activity
As an activity to learn about tally charts, I first ask my class a question with 3 answers and tally them. We then create a tally chart together of the data and talk about the parts that make up the chart. I then have my students develop a question to ask their classmates and then survey their peers, tallying their answers. This is an interactive Smartboard activity that introduces and guides the lesson.
It includes:
-Interactive poll to survey the class
-Scaffolding for how to create a tall
Subjects:
Grades:
4th - 6th

Press Your Luck! (A game of possibilities)
Guy Infinity needs your students' help in selecting his wardrobe. He has 24 possible wardrobe combinations in his closet. Your students will help coordinate his wardrobe by selecting a pair of pants, a shirt, and a tie.
They have a 1 out of 24 chance of selecting THE lucky outfit.
The catch here is that every time the student does not select the lucky wardrobe combination, a multiplication problem is revealed for the class to solve. The class could end up working 23 multiplication prob
Subjects:
Grades:
5th - 7th
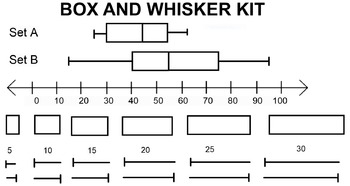
Box and Whisker Plot Construction Kit
This is a Smart Notebook file which can be used to create your own box and whisker plots easily by dragging and dropping the parts together. Includes 4 sets of problems with solution pages. You can use this to create your own box and whisker plot lesson or worksheets.
Subjects:
Grades:
7th - 9th
Box and whisker plots notebook
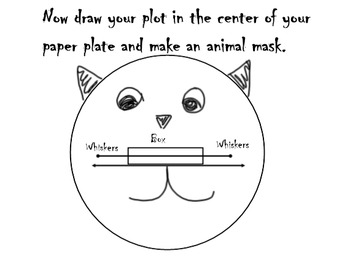
This notebook file can be used on its own or with the box and whisker mask activity worksheet that is also on my page. It is interactive and breaks down box and whisker plots for middle school students with a fun activity!
Subjects:
Grades:
5th - 8th
Pumpkin Circle Graphs notebook
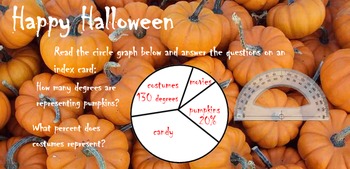
One day I realized that pumpkins look much like a circle graph from the bottom or the top, so I created this notebook file to go along with a Halloween activity. The students love the activity, which asks them opinion questions for the statistics and teaches them how to graph an ACCURATE circle graph. ENJOY!
Subjects:
Grades:
5th - 8th

Probability Game for the SmartBoard
This is a game to reinforce probability. The students can use a soft ball or their fingers to select a ball and answer the question behind it.
Subjects:
Grades:
6th - 8th
Types:

Statistics Shoe Size Lab
8th Grade lab, fun to implement scatter plots into a classroom activity.
Subjects:
Grades:
8th

Grade 6 Engage NewYork Module 1 Lesson 7
Grade 6 Engage NewYork Module 1 Lesson 7
*Customizable
Subjects:
Grades:
6th

Grade 6 Engage NewYork Module 1 Lesson 11
Grade 6 Engage NewYork Module 1 Lesson 11
*Customizable
Subjects:
Grades:
6th

Grade 6 Engage NewYork Module 1 Lesson 5
Grade 6 Engage NewYork Module 1 Lesson 5 SmartNotebook
Subjects:
Grades:
6th

Math Olympics
Students participate in four events and use math to see which team will win the Math Olympics.
Subjects:
Grades:
4th - 8th
Types:
Showing 1-22 of 22 results


