13 results
Graphing printables for SMART Notebook
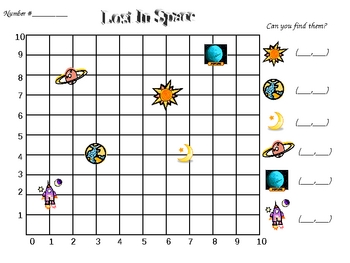
Space Coordinate Grid
Students discover how to read and plot space objects on a coordinate grid. Students learn the easy way to remember the clue of "dribbling and shooting" to plot or read the graph. There is a student sheet embedded in the attachments file section of this SmartBoard lesson.
Subjects:
Grades:
1st - 4th
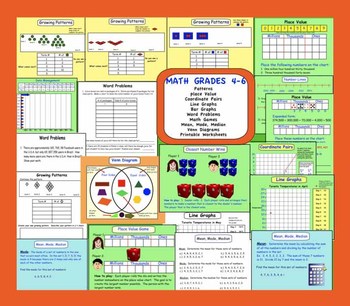
Interactive Smartboard Math Gr. 4-6 (patterning, graphing, venn diagrams)
This is an Interactive Smart Notebook 11 file. You MUST have Smart Notebook Software to download this file. There are 26 junior math pages. Pg 1-4 Growing patterns (interactive lessons and printable worksheets)Pg 5-6 Word problems (extending patterns)Pg 7-8 Place value Pg 9 Number linePg 10 Printable word problems (number sense)Pg 11-12 Place value interactive gamesPg 13-14 Interactive bar graphs (data management)Pg 15-16 Line graphs (interactive & printablePg 17-20 Coordinate pairs (inte
Subjects:
Grades:
4th - 6th
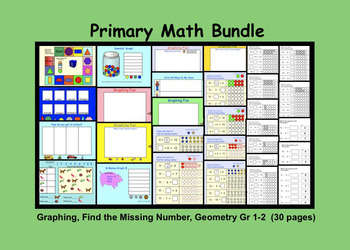
Smartboard Primary Math Bundle: Graphs, Missing Number, Geometry, Printables
This is a Smart Notebook file with 30 pages. This is a combination of 4 popular primary lessons plus 2 bonus Geometry pages.
Find the Missing Number Smart Notebook file $2.00
Find the Missing Number
Find the Missing Number Printables $1.50
Find the Missing Number Printables
Smartboard Interactive Pictographs $1.00
Smartboard Interactive Pictographs
Smartboard Graphing $1.00
Smartboard Graphing
Bonus: 2 Geometry slides
Grades:
1st - 2nd
Thanksgiving SMARTboard Data Collecting, Graphing, Analyzing Lesson
This is a SMARTBoard lesson aligned with Common Core Standards for third grade math. Students conduct a survey of the class' favorite Thanksgiving foods and then record their data in a table. This table is then used to create a graph and then analyze data by answering a variety of questions on multiple thinking levels. Includes Learning Focus School Essential Questions and Key Learning as well as the CCSS. A Teacher's Information Page is also included with key vocabulary and instructional st
Subjects:
Grades:
3rd - 5th
Types:
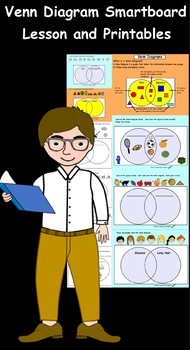
Venn Diagram Interactive Smartboard Lesson and Printables for gr 3-5
This is a Smart Notebook file. You MUST have Smart Notebook software to download this product. There are 15 pages which include interactive pages and printable pages. Each page can be easily edited to suit the individual needs of your classroom. For the interactive slides students are asked to drag items onto the Venn Diagram according to the titles. Some Venn Diagrams are complete and students must determine the sorting rule. I have included thumbnail prints of each page in this product s
Grades:
3rd - 5th
Birthday Graphing SMARTBoard Lesson ~ Back to School
Back to School Graphing Activity
Use students birthdays as an introduction to graphing activity. This is a 6 page .notebook file with information on collecting, organizing, graphing, and analyzing data. Also shares information on the purpose of a survey.
Three page printable also included so students can record data on their individual sheets while the teacher models on the SMARTboard.
CCSS aligned to 3rd grade measurement and data standard.
NOTE: All my SMARTboard files allow for teacher e
Subjects:
Grades:
2nd - 5th
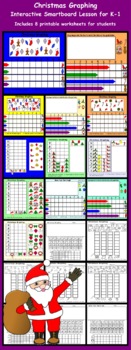
Christmas Graphing Smartboard Activities and Printables for K-1
This is a Smart Notebook file. You MUST have Smart Notebook Software to download this product. There are 20 pages in this file, 12 interactive pages and 8 printable pages for students. Each page can be easily edited to suit the needs of your students. Students are asked to count and graph the data presented on each page. They are asked to drag the images to complete graphs as well as dragging arrows to record info in a bar graph. Please download preview for thumbnail pics of each image in
Subjects:
Grades:
PreK - 1st
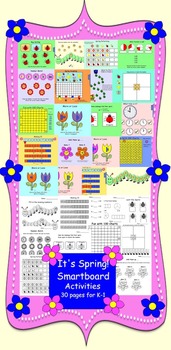
It's Spring! Interactive Smartboard Activities for K-1 (30 pages)
This is a Smart Notebook File. You must have Smart Notebook software to open this file.
There are 30 pages in this product.
20 pages are interactive lesson pages and 10 pages are printable pages for students.
Pages include: placing numbers in sequence, counting, making ten, patterning, more or less, fractions, graphing, sorting, adding, 100 chart activities, telling time to the hour etc.
Grades:
K - 1st
Types:

Open-ended questions coordinate geometry geometric translations
A set of 5 open-ended problems (one for each day of the week) applying coordinate geometry and geometric translations. Modeled after those types of open-ended questions that appear on state standardized graduation tests. Comes with answer keys and a 4-point scoring rubric that's applicable to all 5 problems in the set. Can be used as a "do now" bell-ringer, anticipatory set, closure activity, extra-credit assignment or as a main lesson in and of itself. By Scott Cianci.
Subjects:
Grades:
8th - 11th
Types:
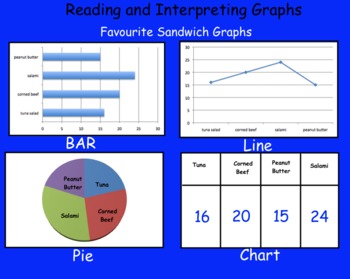
Smartboard: Reading and Interpreting Graphs (bar, pie, pictograph)
This is a Smartboard Interactive Whiteboard file. It contains 4 pages. Students will learn to read and interpret a variety of graphs including bar, pie and pictographs. This file includes an interactive game called "Climb to the top" which students will love.
Grades:
4th

One Variable inequalities and graphing
Smartboard lesson about one variable inequalities, x=1, x>2, x<4... What do they mean and how do we graph them. There are short lessons attached with interactive student lessons in between. I do, we do, you do is the format of this Smartboard lesson. Also, attached are two worksheets with the answers attached ideal for silent work or group work to test their understanding.
Subjects:
Grades:
6th - 9th

Open-ended questions graphing perimeter Pythagorean Theorem
A set of 5 open-ended problems (one for each day of the week) consisting of graphing in the xy coordinate plane and applying the concepts of perimeter and the Pythagorean Theorem. Can also be presented as an application of the distance formula for more advanced students. Modeled after the type of open-ended questions that appear on state standardized graduation tests. Can be used as a "do now" bell-ringer activity, anticipatory set, closure activity, extra-credit assignment or as a main lesso
Subjects:
Grades:
9th - 12th
Types:

Open-ended questions coordinate geometry geometric dilations
A set of 5 open-ended problems (one for each day of the week) applying coordinate geometry and geometric dilations. Students get to explore the relationships between a triangle and its dilated image. Modeled after those types of open-ended questions that appear on state standardized graduation tests. Comes with answer keys and a 4-point scoring rubric that's applicable to all 5 problems in the set. Can be used as a "do now" bell-ringer, anticipatory set, closure activity, extra-credit assignmen
Subjects:
Grades:
8th - 11th
Types:
Showing 1-13 of 13 results


