2,966 results
Graphing independent works $5-10
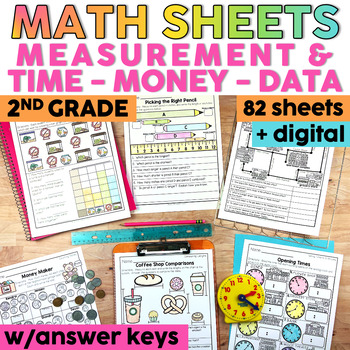
Math Worksheets 2nd Grade -Measurement Telling Time Money & Graphing Activities
Dive into the world of numbers and practical math with these measurement, telling time, counting money, and graphing math worksheets! Tailored specifically for 2nd grade, this pack is your go-to resource for mastering skills in measurement, telling time, handling money, and graphing with ease and confidence.We know most math curriculums do not have enough practice with these important life-long math skills. This pack of worksheets is here to save you and your students!What's Inside?82 no-prep pr
Subjects:
Grades:
2nd
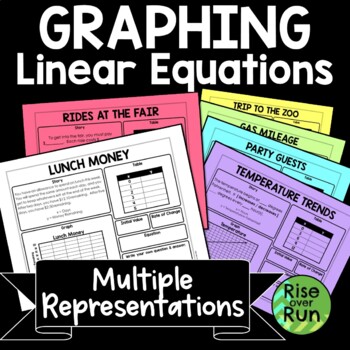
Linear Equations Graphing Worksheets with Multiple Representations
These activity sheets will help students make connections between linear graphs, equations, tables of values, and the stories they represent. This resource is one of my favorites and best sellers! Included are 6 different sheets, each with a different scenario and a different representation given. For example, students may be given an equation, and they must fill in a graph to match, missing parts of the story, a table, and identify the initial value and rate of change. The sheets range in d
Grades:
8th - 9th
Types:
CCSS:
Also included in: 8th Grade Math Activities & Lessons Bundle for the Whole Year
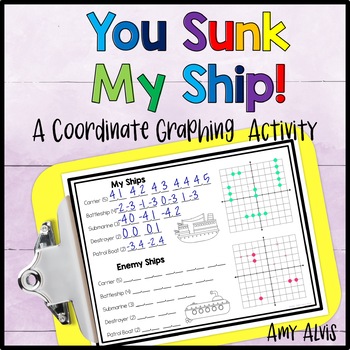
Coordinate Plane Graphing Plotting Points Math Battleship Activity
You Sunk My Ship is a coordinate plane graphing activity, similar to Battleship, where students will battle it out in a head to head competition trying to locate each other's ships. Your students can complete in this engaging and strategic activity while practicing their math skills. Includes file folder game boards for quadrant I practice as well as one that uses all 4 quadrants (4 versions for each one). Also included are one page versions of the activity as well as a quiz.Packet includes:-Te
Subjects:
Grades:
5th - 8th
Types:
Also included in: 6th Grade Coordinate Graphing Bundle Poster INB Game NO PREP Printable
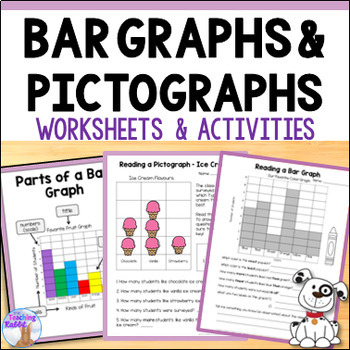
Bar Graphs & Pictographs Worksheets & Activities | Data Management
Are you looking for fun and engaging activities to teach graphing? This data management packet can help 1st and 2nd grade students build their skills by reading and creating bar graphs, picture graphs, & pictographs. It comes with graphing posters, worksheets, and math center activities that can help students learn to read and make observations about data displayed in graphs.This resource can also be found in this bundle:Graphing & Probability Activities - Data Management BundleYou may
Grades:
1st - 3rd
Types:
Also included in: Graphing & Probability Activities Data Management Math Bundle
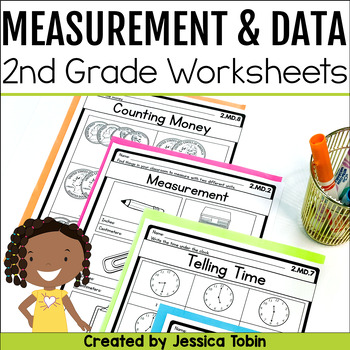
Money Worksheets, Measurement Worksheets, Time Worksheets, 2nd Grade Math
Are you looking for measurement worksheets to help your 2nd grade math lessons? These worksheets cover graphing, telling time, counting money, and measurement! This set of 2nd grade standards-based math worksheets are Common Core aligned to the MD, or Measurement & Data domain.This 2nd Grade standards-based measurement and data worksheet pack is a no-prep resource to use when teaching graphing, counting money, telling time, and measurement activities! With worksheets for topics such as selec
Subjects:
Grades:
2nd
Types:
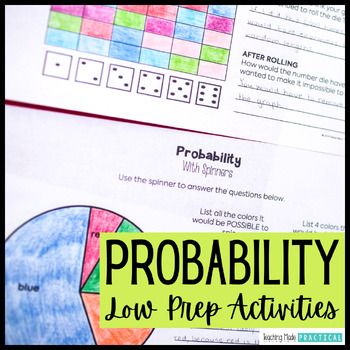
Probability Activities - Fun Review Worksheets, Spinners, Dice, Task Cards
These low prep probability activities and worksheets make a great introduction or review. Students will practice probability vocabulary - certain, impossible, possible, likely, unlikely, and equally likely - and apply these words in a variety of situations and events. Students will also get the opportunity to think about different probability events with hands on practice using spinners, coins, and dice. The fun probability activities include: 6 anchor charts / probability posters to help stu
Subjects:
Grades:
2nd - 5th
Types:
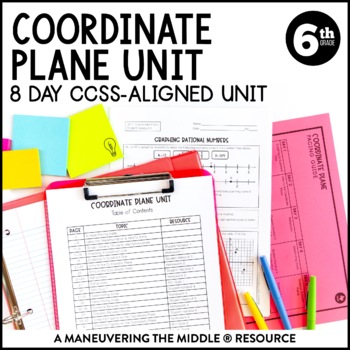
Coordinate Plane Unit | Graph, Reflect, & Find Distance Between Two Points
An 8 day CCSS-Aligned Coordinate Plane Unit - including plotting points on the coordinate plane to absolute value, opposites, and measuring the distance between points.Students will practice with both skill-based problems, real-world application questions, and error analysis to support higher level thinking skills. You can reach your students and teach the standards without all of the prep and stress of creating materials!Standards: 6.NS.6, 6.NS.6a, 6.NS.6b, 6.NS.6c, 6.NS.8; Texas Teacher? Grab
Grades:
5th - 7th
Types:
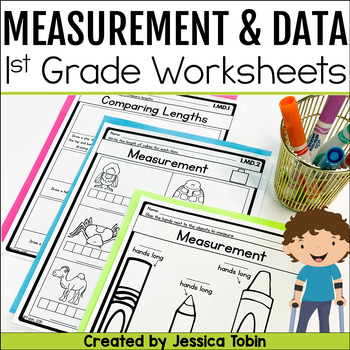
Time Worksheets, Measurement Worksheets, Graphing - 1st Grade Math Review
Are you looking for measurement worksheets to use with your 1st grade math lessons? Specifically, worksheets that cover graphing, telling time, and measurement? This set of 1st grade standards-based math worksheets are Common Core aligned to the MD, or Measurement & Data domain.This measurement and data worksheet pack is a no-pep resource to use when teaching graphing, money, telling time, and measurement! This is not a curriculum, but a resource to help supplement your lessons! With workshe
Subjects:
Grades:
1st
Types:
Also included in: Math Worksheets, 1st Grade Math Review Worksheets Bundle, Common Core
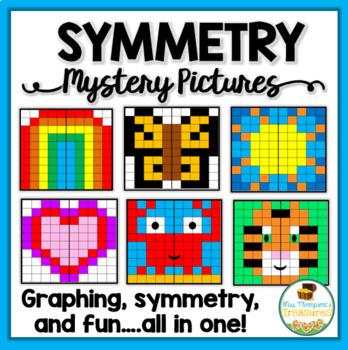
Symmetry Fun {Mystery Picture Graphing Activities}
⭐ These fun graphing activities help students practice following directions, coordinate graphing and symmetry all at the same time!
⭐ The students use the code to color in half a picture on the alphanumeric grid, then they use their knowledge of symmetry to complete the picture.
✅ Includes 15 different pictures plus guided work pages for those students who need a little help finding the coordinates. This allows you to easily differentiate in your classroom!
You may also like:
❤️ Multiplica
Subjects:
Grades:
3rd - 4th
Types:
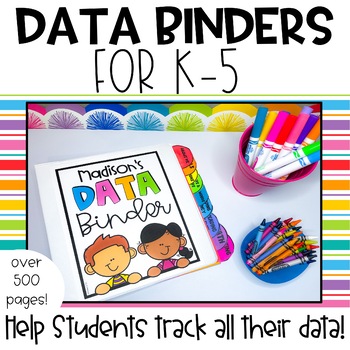
K-5 Student Data Tracking Binders
Seeing students track their own data is amazing. Data tracking binders can help to keep data organized all year long! Track assessments, grades, growth, writing samples, and so much more! Data binders truly help students take ownership of their own learning, and it gets students excited to see the growth that they have made throughout the year! Use these student data binders to have your students track their own data in a kid-friendly way! These binders include over 500 pages to support K-5 stud
Subjects:
Grades:
K - 5th
Also included in: Back to School Resource Bundle | First Week of School
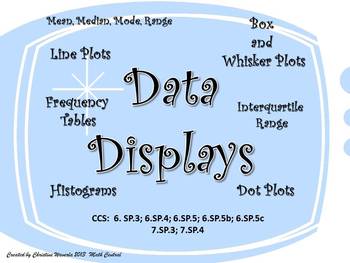
Data Displays: Line Plots, Histograms, Box and Whisker Plots, Frequency Tables
This is one of my favorite teaching tools! I created this Data Display set of worksheets this year for my 6th grade class. My students loved using these worksheets to practice their new skills. Each worksheet provides plenty of room for students to create their data displays and answer questions based on the data. Questions ask students to find the mean, median, mode, range, interquartile range, and percentages.These worksheets are fully aligned with the Common Core Curriculum.CCS: 6.SP.3; 6.SP
Subjects:
Grades:
6th - 8th
Types:
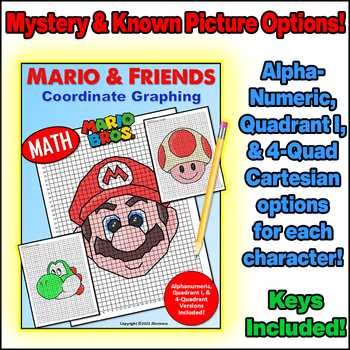
Mario's Nintendo Coordinate Graph Mystery Pictures! March 10 MAR10! Mario Day!
SAVE with the 10 Character Bundle: https://www.teacherspayteachers.com/Product/9249343Alphanumeric, Quadrant I, and Full Cartesian Grid versions of each picture are included!Coordinate Plane Graphing can be fun, and the pictures students graph don’t have to be boring! Each character comes with blank coordinate planes and complete instructions to graph them.All of my coordinate graphs use whole numbers... No fractions or decimals to confuse the graphing!In this set, you will find 3 versions of th
Subjects:
Grades:
3rd - 8th
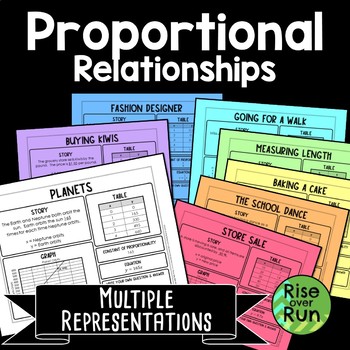
Proportional Relationships Graphing with Multiple Representations
These multiple representation math tasks help students make connections between graphs, tables, equations, and real world scenarios. Students are given a little information and must think how to fill in the rest!8 activity sheets each include: a story a grapha tableconstant of proportionalityan equation a space for students to write their own question and answer. A blank template is included as well so students can create their own proportional relationship.Multiple representations are a great w
Grades:
7th - 8th
Types:
Also included in: 8th Grade Math Activities & Lessons Bundle for the Whole Year
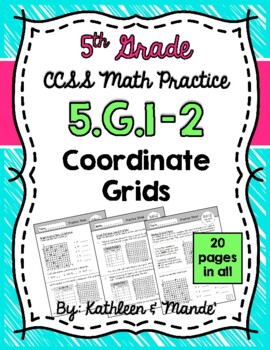
5.G.1-2 Practice Sheets: Coordinate Grids
This 5.G.1-2 CCSS aligned geometry packet includes 20 practice sheets to teach/reinforce naming and graphing points on a coordinate grid as well as graphing and interpreting patterns. These sheets can be used to introduce a concept, review a concept, or send home as reinforcement for homework. An answer key is provided.------------------------------------------------------------------------------------------------------------Check out our other 5.G.1-2 resources:5.G.1-2 Assessment: Coordinate Gr
Grades:
4th - 6th
Types:
Also included in: 5.G.1-2 BUNDLE: Coordinate Grids
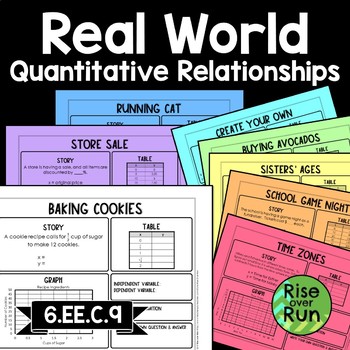
6th Grade Real World Graphs with Independent & Dependent Variables
These multiple representation math tasks help students make connections between graphs, tables, equations, and real world scenarios. Students are given a little information and must think how to fill in the rest! 7 activity sheets are provided, and each one includes: a story a grapha tablean equation independent and dependent variablesa space for students to write their own question and answerEach sheet provides just enough information so students can figure out the rest! A blank template is i
Grades:
6th
Types:
CCSS:
Also included in: 6th Grade Math Activities Bundle
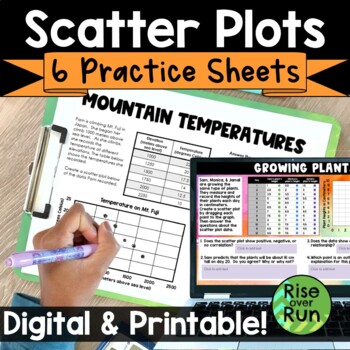
Scatter Plots & Line of Best Fit Practice Worksheets
Practice using scatterplots with these six activities. They can be used as bell ringers, exit tickets, homework, or just general practice. Students graph points, interpret data, and look for types of correlation with these practice sheets. All practice sheets are included as printable PDFs and interactive Google Slides. 6 scatter plot activities are included:Test Grades Scatter Plot PracticeMountain Temperatures Scatter Plot PracticeGrowing Plants Scatter Plot PracticeHair Length Data Collectio
Grades:
8th - 9th
Types:
CCSS:
Also included in: 8th Grade Math Activities & Lessons Bundle for the Whole Year
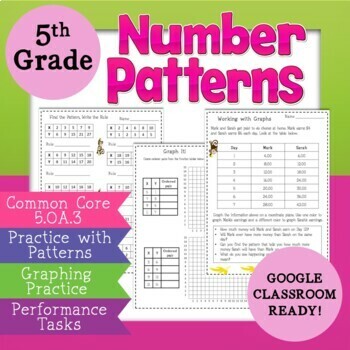
5.OA.3 5th Grade Number Patterns/Coordinate Plane/Ordered Pairs
Need a resource for graphing numbers on the coordinate plane, ordered pairs, and recognizing number patterns? These practice worksheets and activities are CCSS aligned to 5.OA.3 .A great supplemental unit for more practice with turning patterns into mathematical equations, understanding and using coordinate pairs as well as graphing real-world problems. Help your students work through finding patterns, completing function tables, and beginning graphing. This unit on number patterns has a suppor
Subjects:
Grades:
4th - 5th
Types:
CCSS:
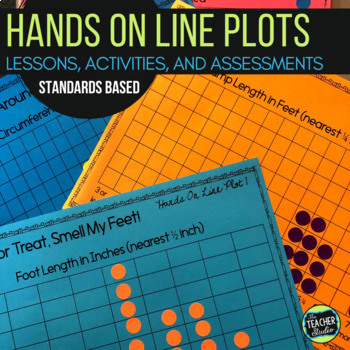
Hands On Line Plot Activities, Investigations and Line Plot Assessments
Do you struggle to find quality line plot resources that are fun AND instructional? Line plots are a key part of many sets of math standards for intermediate grades—but many textbooks give very limited opportunities for meaningful math practice with them. This resource is designed to get students interpreting line plots, making line plots, collecting data, and more! Includes line plots with whole numbers AND line plots with fractions. Line plots actually address so many math concepts--and the
Subjects:
Grades:
3rd - 5th
Types:
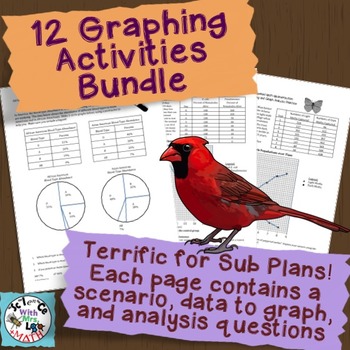
Graphing Practice Bundle: 12 Pages to Graph with Analysis Q's - Great Sub Plans!
Included in this bundle are 12 different graphing pages! Each page gives the students a different scenario, data, and space to graph that data. Each page then includes 1-3 questions that ask the student to analyze the graph. Many provide a possible explanation for the graph’s trend. Included are several scatter plot type graphs, one bar graph, and one circle graph activity. Each page is followed by an answer key!Some of the analysis questions are left purposely a little vague! I like my st
Subjects:
Grades:
7th - 12th
Types:
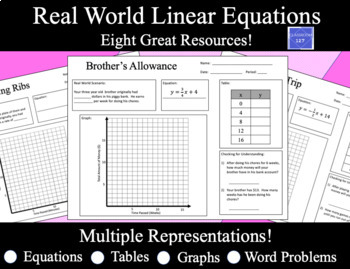
Linear Functions Word Problems: Multiple Representations
This product is GREAT at having students make connections between real world scenarios, tables, equations written in slope intercept form, and linear graphs!This product contains eight different resources about different real world scenarios that have a constant rate of change. Information is presented to students in only one of four ways. The four ways that students can be presented with information about the real world situation includeBy a word problemBy an equation written in slope intercep
Grades:
7th - 10th
Types:
CCSS:
Also included in: Custom Bundle for Chris
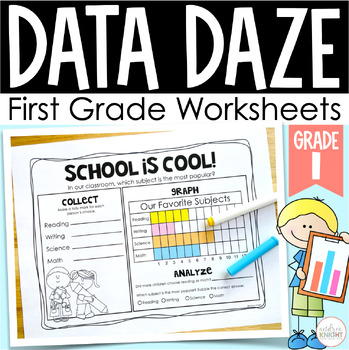
Collecting, Graphing, and Interpreting Data - First Grade Math Skills Worksheets
ORGANIZE, REPRESENT, AND INTERPRET DATA - 1.MD.C.4I created this packet to provide my students with additional practice on collecting, graphing, and analyzing data using tally charts, picture graphs, and bar graphs. THE SET INCLUDES: vocabulary picture cards for 6 key termspicture graphs and bar graphs with preloaded data to analyzeseveral open-ended graphing pages, allowing children to collect real data from their peersThe analyzing pages vary in problem-solving difficulty and allow students to
Subjects:
Grades:
1st
Types:
Grade 3, Unit 3: Data Literacy (Ontario Math)
Grade 3, Unit 3: Data Literacy is a 150+ paged resource designed to meet the Ontario 2020 Mathematics curriculum expectations for the Data strand. This resource includes lessons, activities, and assessments that introduce students to bar graphs, pictographs, frequency tables, and sorting using three attributes. Please note this is a printable resource. There is NO Google Slide component to this resource.Wonderland Math is a math unit series designed to meet the Ontario 2020 Mathematics curriculu
Subjects:
Grades:
3rd
Types:
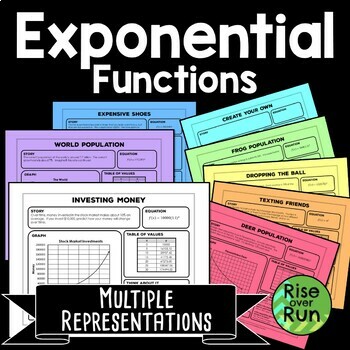
Exponential Growth and Decay Worksheets with Real World Stories
Explore exponential functions with multiple representations with these activity task sheets. Students fill in the missing information by completing a story, equation, graph, and table of values. Then they answer questions and identify if the function is exponential growth or decay.The worksheets are included in a printable version and a digital version for Google Slides.Topics include population growth and decay, investing money, multiple discounts, ball bounce heights, and chain text messages.T
Subjects:
Grades:
9th - 11th
Types:
CCSS:
Also included in: Algebra 1 and 8th Grade Math Curriculum Bundle for Entire Year
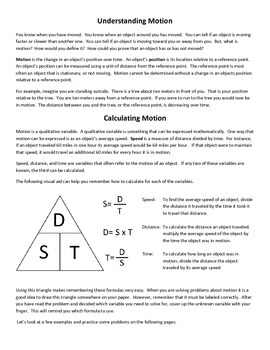
Calculating Speed, Time, Distance, and Graphing Motion - Distance Time Graphs
This activity is centered around the concept of motion. This activity defines motion and gives instruction and examples on how it cat be calculated and graphed. This activity includes informational text on calculating and graphing motion as well as a variety of problems to check for understanding. There are problems that involve solving for speed, distance traveled, and time in motion. Distance vs. Time and Speed vs. Time graphs are discussed. Twelve distance vs. time graphs and twelve spe
Subjects:
Grades:
4th - 9th
Showing 1-24 of 2,966 results


