620 results
Graphing assessments $5-10
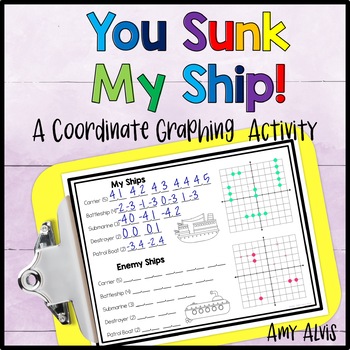
Coordinate Plane Graphing Plotting Points Math Battleship Activity
You Sunk My Ship is a coordinate plane graphing activity, similar to Battleship, where students will battle it out in a head to head competition trying to locate each other's ships. Your students can complete in this engaging and strategic activity while practicing their math skills. Includes file folder game boards for quadrant I practice as well as one that uses all 4 quadrants (4 versions for each one). Also included are one page versions of the activity as well as a quiz.Packet includes:-Te
Subjects:
Grades:
5th - 8th
Types:
Also included in: 6th Grade Coordinate Graphing Bundle Poster INB Game NO PREP Printable
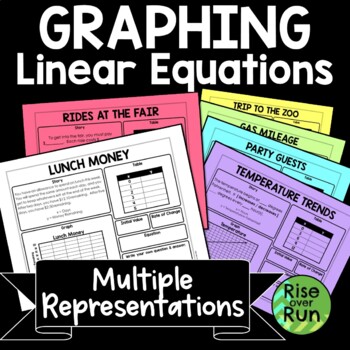
Linear Equations Graphing Worksheets with Multiple Representations
These activity sheets will help students make connections between linear graphs, equations, tables of values, and the stories they represent. This resource is one of my favorites and best sellers! Included are 6 different sheets, each with a different scenario and a different representation given. For example, students may be given an equation, and they must fill in a graph to match, missing parts of the story, a table, and identify the initial value and rate of change. The sheets range in d
Grades:
8th - 9th
Types:
CCSS:
Also included in: 8th Grade Math Activities & Lessons Bundle for the Whole Year
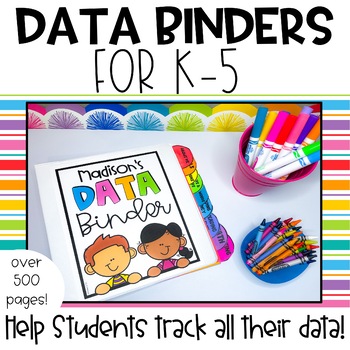
K-5 Student Data Tracking Binders
Seeing students track their own data is amazing. Data tracking binders can help to keep data organized all year long! Track assessments, grades, growth, writing samples, and so much more! Data binders truly help students take ownership of their own learning, and it gets students excited to see the growth that they have made throughout the year! Use these student data binders to have your students track their own data in a kid-friendly way! These binders include over 500 pages to support K-5 stud
Subjects:
Grades:
K - 5th
Also included in: Back to School Resource Bundle | First Week of School
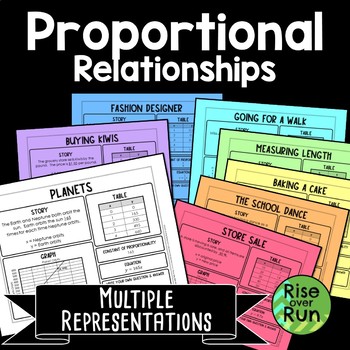
Proportional Relationships Graphing with Multiple Representations
These multiple representation math tasks help students make connections between graphs, tables, equations, and real world scenarios. Students are given a little information and must think how to fill in the rest!8 activity sheets each include: a story a grapha tableconstant of proportionalityan equation a space for students to write their own question and answer. A blank template is included as well so students can create their own proportional relationship.Multiple representations are a great w
Grades:
7th - 8th
Types:
Also included in: 8th Grade Math Activities & Lessons Bundle for the Whole Year
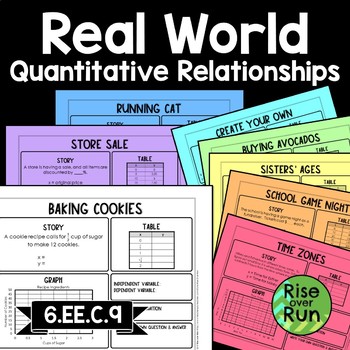
6th Grade Real World Graphs with Independent & Dependent Variables
These multiple representation math tasks help students make connections between graphs, tables, equations, and real world scenarios. Students are given a little information and must think how to fill in the rest! 7 activity sheets are provided, and each one includes: a story a grapha tablean equation independent and dependent variablesa space for students to write their own question and answerEach sheet provides just enough information so students can figure out the rest! A blank template is i
Grades:
6th
Types:
CCSS:
Also included in: 6th Grade Math Activities Bundle
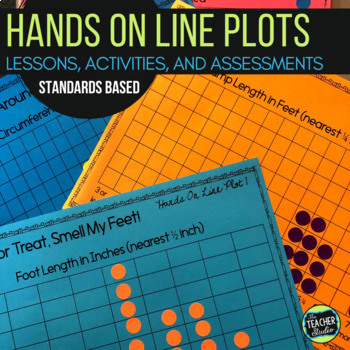
Hands On Line Plot Activities, Investigations and Line Plot Assessments
Do you struggle to find quality line plot resources that are fun AND instructional? Line plots are a key part of many sets of math standards for intermediate grades—but many textbooks give very limited opportunities for meaningful math practice with them. This resource is designed to get students interpreting line plots, making line plots, collecting data, and more! Includes line plots with whole numbers AND line plots with fractions. Line plots actually address so many math concepts--and the
Subjects:
Grades:
3rd - 5th
Types:
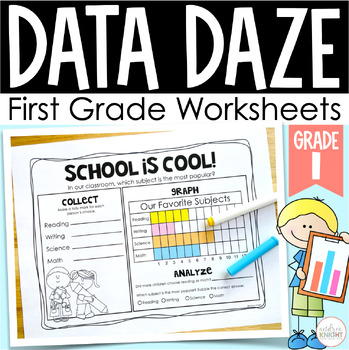
Collecting, Graphing, and Interpreting Data - First Grade Math Skills Worksheets
ORGANIZE, REPRESENT, AND INTERPRET DATA - 1.MD.C.4I created this packet to provide my students with additional practice on collecting, graphing, and analyzing data using tally charts, picture graphs, and bar graphs. THE SET INCLUDES: vocabulary picture cards for 6 key termspicture graphs and bar graphs with preloaded data to analyzeseveral open-ended graphing pages, allowing children to collect real data from their peersThe analyzing pages vary in problem-solving difficulty and allow students to
Subjects:
Grades:
1st
Types:
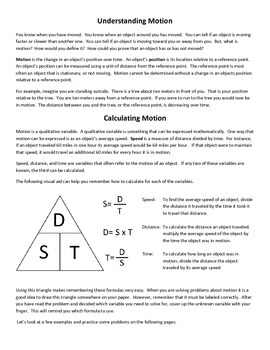
Calculating Speed, Time, Distance, and Graphing Motion - Distance Time Graphs
This activity is centered around the concept of motion. This activity defines motion and gives instruction and examples on how it cat be calculated and graphed. This activity includes informational text on calculating and graphing motion as well as a variety of problems to check for understanding. There are problems that involve solving for speed, distance traveled, and time in motion. Distance vs. Time and Speed vs. Time graphs are discussed. Twelve distance vs. time graphs and twelve spe
Subjects:
Grades:
4th - 9th
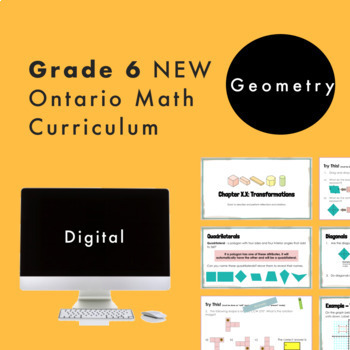
Grade 6 Ontario Math - Geometry Curriculum - Digital Google Slides+Form
Are you planning for the NEW Grade 6 Ontario Math Curriculum? This fully editable Google Slide resource is what you need! *Note that this contains NEW lessons with added expectations from the new curriculum. This resource is for the SPATIAL SENSE strand and covers ALL specific expectations for “E1. Geometric and Spatial Reasoning”. In this resource, students will experience math through engaging real-life questions, storytelling through math, and interactive slides. For teachers who are given N
Grades:
5th - 7th
Types:
Also included in: Grade 6 NEW Ontario Math Curriculum Full Year Digital Slides Bundle
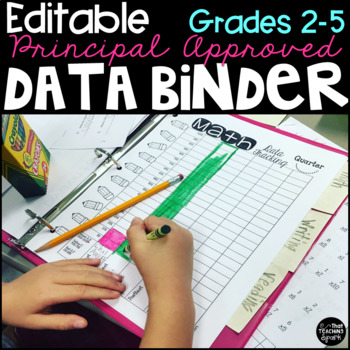
Editable Student Data Tracking Binder Grades 2-5
Ready to watch your students' score skyrocket? Allow them to start tracking their own data! Have your kiddos record their pretests, set goals, learn, and then watch as their post test scores blow you away! Perfect for educators who are evaluated using the Marzano Evaluation Model. This file is editable!
Download the preview to see all the magic included!
This Data Binder includes...
Every page below (except math facts) includes a NONeditable AND an EDITABLE version!
Girl Binder Cover
Boy
Grades:
2nd - 5th
Types:

Beaker Pong: Experimental Design and Graphing Lab, NGSS aligned
Great 1st week or 1st month STEM activity! All parts are EDITABLE and includes a graphing grid! This is a great way to introduce the "science process" (better phrase for scientific method) at the start of a semester or anytime you want fun to occur in your classroom.*****Focus on the NGSS PRACTICES Dimension*****The National Research Council's (NRC) Framework describes a vision of what it means to be proficient in science; it rests on a view of science as both a body of knowledge and an evidenc
Subjects:
Grades:
7th - 12th
Types:
Graph Points on the Coordinate Plane (Mini Bundle) - Distance Learning
This is an awesome bundled lesson that will have your kids accurately graphing points on the coordinate plane in no time.Included in this bundled unit:PowerPointThe entertaining, interactive, and easy-to-understand 17-slide PowerPoint walks learners through:-The development of the coordinate plane-Basic graphing and coordinate plane terminology: x-axis, y-axis, ordered pair, coordinates, origin, quadrant, etc.-Plotting point demonstrations-Various plotting point practice (three slides)These embe
Subjects:
Grades:
5th - 6th
Analyzing Plots, Graphs, and Tables using Measures of Central Tendency
This product provides students the opportunity to analyze data presented in different ways. By making calculations and analyzing data, students make conjectures and justify them using mathematical reasoning and evidence!What is included?This product contains 8 student work pages. Each work page contains a set of data displayed graphically with accompanying questions. The data displays included are 2 dot plots, 2 bar graphs, 2 frequency tables, and 2 stem-and-leaf plots. Students are required
Subjects:
Grades:
5th - 11th
Types:
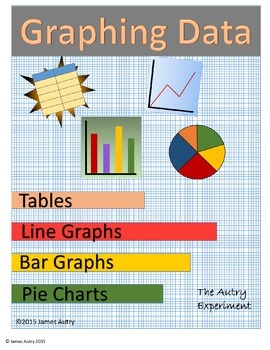
Graphing
Graphs and Graphing Data: Tables, Bar Graphs, Line Graphs, and Pie Charts. This is a 27 page science/math reading comprehension activity with multiple choice and short answer questions throughout.
This packet is meant to be a stand-alone activity for elementary and middle school aged children on some of the more common graphs used in science, mathematics, and business.
There are informative passages on tables, bar graphs, line graphs, and pie charts. Multiple variable bar and line graphs
Subjects:
Grades:
4th - 7th
Types:
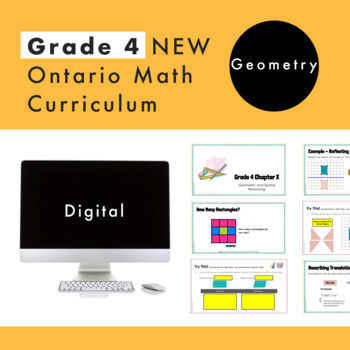
Grade 4 Ontario Math - Geometry Curriculum - Digital Google Slides + Form
Are you planning for the NEW Grade 4 Ontario Math Curriculum? This editable Google Slide and Google Form resource is what you need! This resource is for the SPATIAL SENSE strand and covers ALL specific expectations for “E1 Geometric and Spatial Reasoning”. In this resource, students will experience math through engaging real-life questions, storytelling through math, and interactive slides. What’s Included4 Google Slide presentations95 UNIQUE and EDITABLE Google Slides in totalSlides are edita
Grades:
3rd - 5th
Types:
Also included in: Grade 4 NEW Ontario Math Curriculum Full Year Digital Slides Bundle
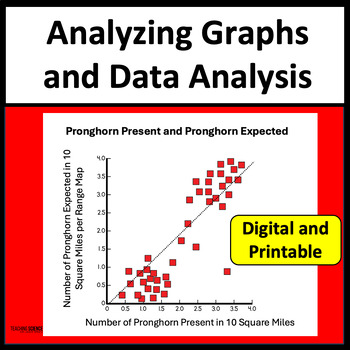
Analyzing Graphs and Data Analysis Middle School Science Test Prep and Practice
Do your students need practice with analyzing graphs? These science graph worksheets include data analysis with different types of graphs. They are great for science test prep and critical thinking. This set includes 25 pages of science graphs with questions. You will get a printable PDF with a link to Google Slides.This Ecosystem Graph Practice Unit Includes:25 printable pages of charts and diagrams with questions(Google Slides and Printable PDF)Answer KeysTwo simplified graphing pages for diff
Subjects:
Grades:
6th - 8th
Types:
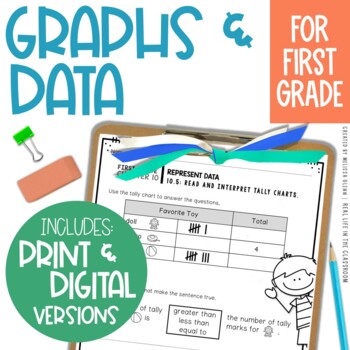
Go Math Chapter 10 Graphs and Data, First Grade
Help all of your students understand how to represent data with these fabulous extra practice pages!*This resource can be used in conjunction with Go Math! for first grade, but will work great with any math program!*********************************************************************************************************************************************Checkout the money-saving BUNDLE of extra practice for all 12 Go Math Chapters by clicking here!************************************************
Grades:
1st
Types:
CCSS:
Grade 7, Unit 3: Data Management (Ontario Mathematics)
The Grade 7, Unit 3: Data Management Activity Packet is the third math unit in the Grade 7 math series. This packet is aligned with the 2005 Ontario Mathematics curriculum expectations for Grade 7: Data Management. With this packet, students are introduced to what relative frequency tables and circle graphs are. Students learn how to construct the relative frequency tables and circle graphs. Students also explore the connections between relative frequency tables and circle graphs. What overall
Subjects:
Grades:
7th
Types:
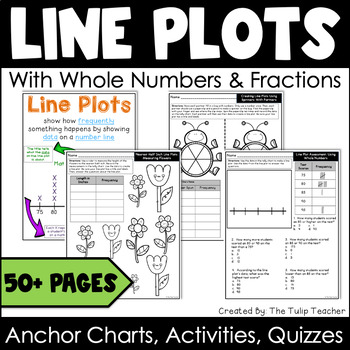
Line Plot Unit Games, Activities, Assessments, Anchor Charts
Looking for an engaging low prep way to practice line plots? This line plot activity packet includes a variety of games, visual aids, practice worksheets, and assessments. All line plots focus on either whole number data or fractional data. The fractional data focuses on measurements using inches, half inches, and quarter inches. The activities are organized in a progressive manner with like activities grouped together. Some activities follow the same format with minor changes. This was done wit
Subjects:
Grades:
3rd - 4th
Types:
Also included in: Math BUNDLE Area, Perimeter, Geometry, Elapsed Time, Line Plots & More!
Random Samples & Populations Card Sort Activity Lesson
This lesson unit is intended to help you assess how well students are able to understand that statistics can be used to gain information about a population by examining a sample of the population; generalizations about a population from a sample are valid only if the sample is representative of that population. Understand that random sampling tends to produce representative samples and support valid inferences. Use data from a random sample to draw inferences about a population with an unknown c
Subjects:
Grades:
7th
Types:
Also included in: Math Card Sort Activity Grade 7 BUNDLE
Algebra 2 Midterm and Final Exam | Semester Review | End of the Year Assessments
Do you want an easy way to create a midterm or final exam for Algebra 2? Functions and graphing included – linear, quadratic, exponential, logarithmic, radical, polynomial, rational, trigonometry and more! This EDITABLE assessment includes over 200 pre-made multiple choice questions, empowering you to create a truly unique exam for the semester or the full year! Simply drag and drop the questions into the template, and voila, your exam is ready to print and go!INCLUDED:- Exam Template- 200+ Que
Subjects:
Grades:
9th - 11th
Types:
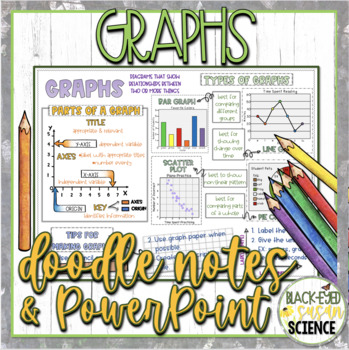
Graphs Doodle Notes & Quiz + Power Point
-DIFFERENTIATED CONCEPT NOTES -QUIZ -ANSWER KEYS -RIGOROUSDo your students love to doodle while taking notes? Don't fight it, embrace it with Doodle Notes (aka Squiggle Sheets)!!!These notes are not only fun but help students to meet Next Generation Science Standards.Notes are differentiated. 3 versions are included. Use the included answer key or choose to use the blank version to make the notes your own.Some things covered in these notes:parts of graphstipstypes of graphsbarlinecirclescatter
Grades:
6th - 8th
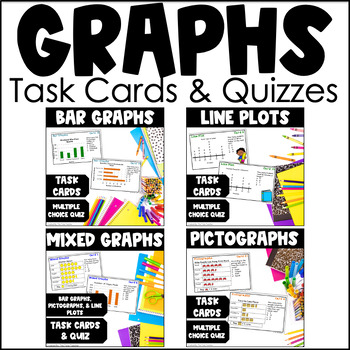
Graph Task Card Bundle with Bar Graphs, Pictographs, Line Plots
Looking for a set of task cards covering bar graphs, line plots, and pictographs? This graphing bundle includes a total of 96 task cards and four graph quizzes. Your purchase will included four separate sets of task cards with 24 task cards in each set. Each task card has a multiple choice word problem about the graph’s data. Word problems include addition, subtraction, multi-step problems, multiplication, and questions focused on interpreting graph data. Some line plots focus on measurement dat
Subjects:
Grades:
2nd - 4th
Types:
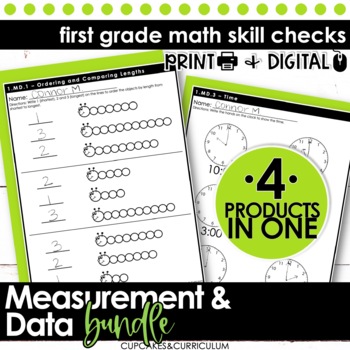
Bar Graphs Worksheets, Telling Time Worksheets 1st Grade & Measurement and Data
This BUNDLED first grade math resource includes printable and digital math worksheets that give your first graders practice ordering and comparing lengths, measuring objects, telling time to the hour and half hour, and analyzing bar graphs and their data (1MD1, 1MD2, 1MD3, 1MD4). These Common Core aligned math quick checks are perfect for morning work, assessment, homework, review, fast-finisher activities, exit tickets, and math centers. These math worksheets are provided in THREE formats to be
Subjects:
Grades:
1st
Types:
Showing 1-24 of 620 results


