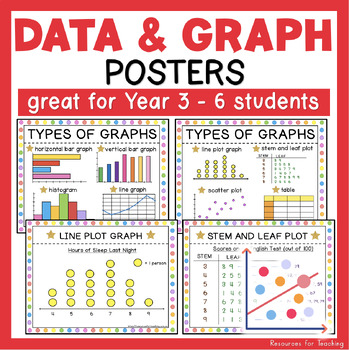
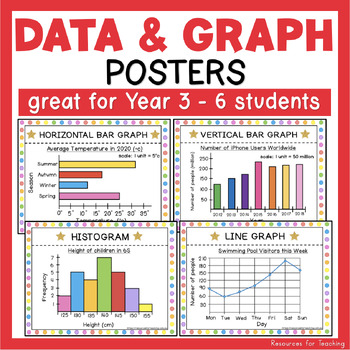
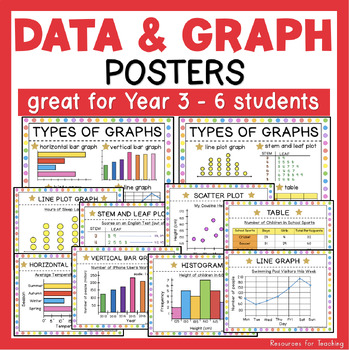
Types of Graphs Maths Posters for Year 3, 4, 5 & 6 Students
- PDF
What educators are saying
Description
These vivid types of graphs maths posters are perfect for Year 3, 4, 5 & 6 students learning to collect, interpret and organise data in math lessons. All these posters are fantastic for using during a class discussion to differentiate between different graphs by looking at the physical characteristics and then interpreting the information.
The Posters Include:
1) Types of Graphs: horizontal bar graph, vertical bar graph, histogram, line graph, line plot graph, stem and leaf plot, scatter plot and table with an illustration of each style all on one page
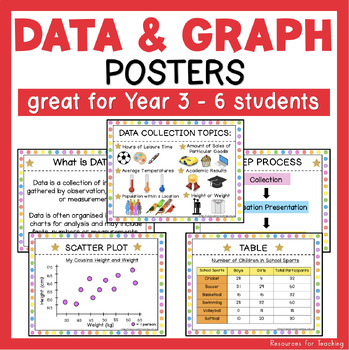
2) Data Collection Topics: a visual list of different topics the students could use to create their own graphs using numerical and categorical data (this could be used as a class discussion)
3) What is Data?: provides students with a simple definition of what data is and how we can organise it
4) 3-Step Process: collection - organisation - interpretation
5) Horizontal Bar Graph: provides an example of this style with an illustration (see preview)
6) Vertical Bar Graph: provides an example of this style with an illustration (see preview)
7) Histogram: provides an example of this style with an illustration (see preview)
8) Line Graph: provides an example of this style with an illustration (see preview)
9) Line Plot Graph: provides an example of this style with an illustration (see preview)
10) Stem and Leaf Plot: provides an example of this style with an illustration (see preview)
11) Scatter Plot: provides an example of this style with an illustration (see preview)
12) Table: provides an example of this style with an illustration (see preview)
13) Horizontal Bar Graph Template: for students to create their own
14) Vertical Bar Graph Template: for students to create their own
15) Histogram Template: for students to create their own
16) Line Graph Template: for students to create their own
17) Line Plot Graph Template: for students to create their own
18) Stem and Leaf Plot Template: for students to create their own
19) Scatter Plot Template: for students to create their own
20)Table Template: for students to create their own
For this resource, you can print, cut and laminate, then use them as posters to display in your classroom. Or you can print 2 slides to a page and laminate them and use as display cards for students who are struggling and need extra scaffolding.
A fantastic resource that helped my students understand how to read, interpret and create their own graphs!
★ Please leave your review after downloading this resource, feedback is really important to us, and you will earn TPT credits for future purchases!
If you have any questions, please feel free to ask us below or email info@resourcesforteaching.com.au.


