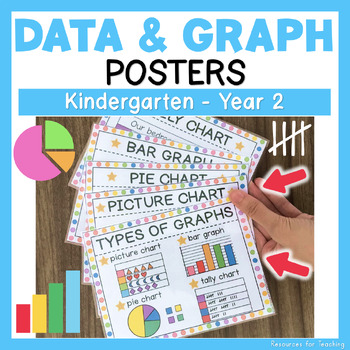
Types of Graphs Maths Posters for Kindergarten, Year 1 and 2 Students
- PDF
What educators are saying
Also included in
- This data and graphing BUNDLE is a massive time-saver for Year 1 & 2 teachers! Includes plenty of materials that are wonderful for teaching students how to interpret, analyse and collect data. This download comes with informational slides, multiple choice questions, task cards, worksheets and poPrice $12.80Original Price $16.00Save $3.20
Description
An excellent learning tool for Kindergarten, Year 1 and 2 students. Aligned with the Australian Curriculum (ACMSP263, ACMSP048, ACMSP049 & ACMSP050).
These colourful posters can also be used as display cards for children learning how to collect, interpret and organise data in math lessons. All these posters are fantastic during a class discussion to differentiate between different graphs by looking at the physical characteristics and then interpreting the information.
Posters include:
1) Types of Graphs: picture chart, bar graph, tally chart and pie chart with an illustration of each style all on one page
2) Data Collection Topics: a visual list of different topics the students could use to create their own graphs using numerical and categorical data (this could be used as a class discussion
3) Types of Data: provides students with a simple definition of categorical and numerical data
4) Picture Chart: provides an example of this style with an illustration (see preview)
5) Bar Graph: provides an example of this style with an illustration (see preview)
6) Tally Chart: provides an example of this style with an illustration (see preview)
7) Pie Chart: provides an example of this style with an illustration (see preview)
8) Picture Chart Template: for students to create their own
9) Bar Graph Template: for students to create their own
10) Tally Chart Template: for students to create their own
11) Pie Chart Template: for students to create their own
Teachers can print, cut and laminate them, then use them as posters to display in the classroom. Or print 2 slides to a page and laminate them and use as display cards for students who need extra scaffolding during lessons.
This resource helped my students understand how to read, interpret and create their own graphs! If you have any questions, please feel free to ask us or email info@resourcesforteaching.com.au.
★ Please leave your review after downloading this resource, feedback is really important to us, and you will earn TPT credits for future purchases!


