208 results
Laboratories for Microsoft Excel in English (UK)
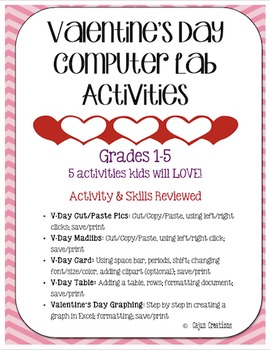
Valentine's Day Computer Lab Activities
There are 5 Valentine's Day activities using Microsoft Word & Microsoft Excel in this download!
Review the following skills as your students complete these activities!
• V-Day Cut/Paste Pics: Cut/Copy/Paste the matching word to the picture, using left/right clicks; save/print
• V-Day Madlibs: Cut/Copy/Paste words into blanks to make a funny story, using left/right click; save/print
• V-Day Card: Challenge students to type a personal message on the front, back, and insides of cards; use sp
Grades:
1st - 5th
Types:
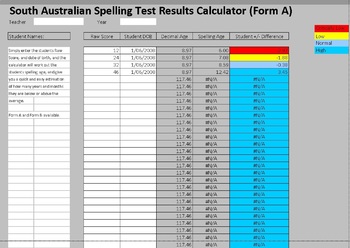
South Australian Spelling Test Calculator
Easily calculate results for the South Australian Spelling Test.
Subjects:
Grades:
2nd - 6th
Types:

BACK TO SCHOOL BUBBLEGUM SCIENCE LAB
Break the ice of the first few days of back to school science class, while teaching your students your expectations of how to write an excellent lab report. This fun, high interest student lab does just that. In groups of three, students will chew bubblegum and measure the bubbles to see if sugar free bubblegum makes bigger bubbles than regular bubblegum. Students can collect their data on the form provided and use our pre-formatted Microsoft Excel spreadsheet to create a line chart and colu
Subjects:
Grades:
7th - 12th
Types:
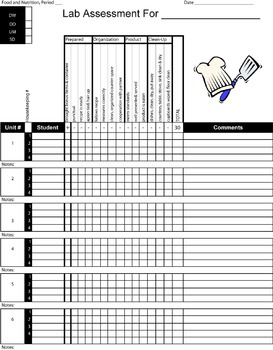
Foods Lab Evaluation Sheet 2 - Teacher Version
This is another template to collect data / assess and evaluate students' performance in the foods lab.
This template is in an Excel format so you can have a master copy for your students' names and change and edit as you go.
The categories for assessment are:
Prepared
Organization
Product
Clean Up
There are 3-4 criteria that fall under each category.
Subjects:
Grades:
4th - 12th
Types:
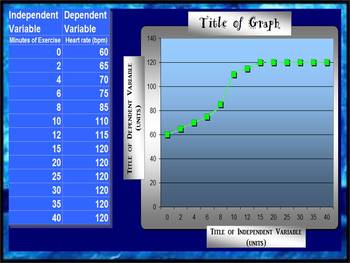
LINE GRAPH MAKER (AUTOMATIC)
This spreadsheet allows you to insert your independent and dependent variables into a chart and voila!... a line graph is generated as you enter in each piece of new data! Students love to take their data from a lab and watch as a graph is made right before their eyes! You can change all of the titles on the chart and the graph to suit your classes laboratory experiment needs! Students can easily print out their data to include in their lab reports!
Grades:
2nd - 12th
Types:
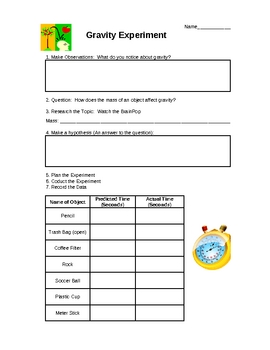
Gravity Experiment
In this experiment, students use the scientific method to explore gravity. Every step of the scientific method is included. Students use common items to test the speed of falling from a certain height. Students also create a line graph during their analysis. This experiment is a fun way to remind students about this scientific method while incorporating math.
Subjects:
Grades:
4th - 6th
Types:
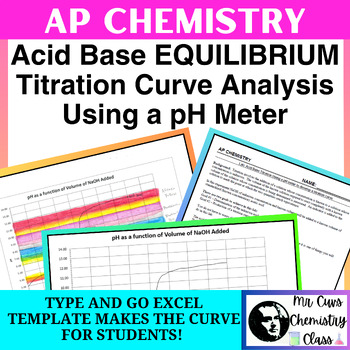
Experiment Analysis: Acid Base Titration in AP Chemistry Utilizing a pH Meter
The Advanced placement AP Chemistry Acid Base Titration Experiment Lab Curve Analysis Using a pH Meter is a "tried and true" lab designed to take 45-50 minutes and I have used it in my AP Chemistry classroom for over 15 years. The lab includes an excel template for students to easily make the titration curve and includes directions.Upon the conclusion of this lab students will be able to:Perform a titration accurately and quickly (I do this lab in one 50 minute period). Make a titration curve u
Subjects:
Grades:
10th - 12th, Higher Education
Types:
workbook animal names for kids
The "Kids Color Number Workbook" is an engaging and educational resource designed to introduce young children to the world of numbers and colors in a fun and interactive way. This beautifully crafted workbook is a perfect tool for parents, caregivers, and educators to help children aged 3 to 6 develop essential skills while having a blast.Inside the workbook, young learners will discover a wide array of captivating activities that combine coloring with number recognition. Each page features char
Subjects:
Grades:
PreK
Types:
Weather Tracking in Excel
Compatible with Google Sheets, Google Classroom, or as a stand-alone file on a PC, this product is a must have for any teacher comparing weather conditions in multiple locations!
BEFORE YOU BUY: This file is part of a larger unit. Save yourself money by purchasing the Super Science Set for Weather and Climate nstead of buying each file separately.
Purchased alone, you get:
⭐ An Excel workbook that enables students to track the weather for 5 different locations as a whole class or individ
Subjects:
Grades:
4th - 8th
Types:
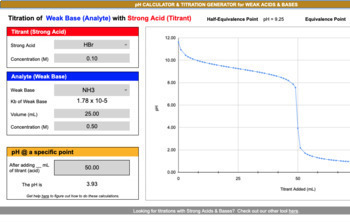
pH Calculator & Titration Curve Generator - WEAK Acids & Bases
We created this useful online titration curve generator and pH calculator tool so that you can enjoy effortless, reliable and quick acid-base titration reaction calculations. In addition to viewing the titration curve generated from a variety of weak acid and base choices, the major points on the curve are also included: equivalence and half-equivalence points. Interested to know the pH at a specific point according to different volume and molarity inputs? You are in luck. This tool allows you
Subjects:
Grades:
7th - 12th, Higher Education, Adult Education
Types:

3400+ ChatGPT Prompts Bundle, business, , Copywriting, Email Marketing,career
3400+ ChatGPT Prompts Bundle, business, , Copywriting, Email Marketing,careerchatgpt prompts, make money online, small business, business growth, content ideas, e-commerce,AI Chatbot,Natural Language Processing,Conversational AI,Virtual Assistant,Language Model,ChatGPT Promotions,Human-like Text Generation,OpenAI Technology,Smart Chat Applications,AI-driven Conversations,Advanced Language Understanding,Text-based Interactiontion SolutionsText-based Interaction,AI Language Understanding,Next-Gen
Grades:
K - 2nd, Higher Education
Types:
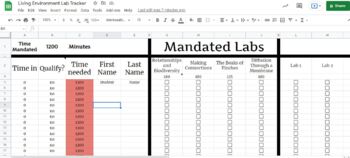
Living Environment Lab Tracker
Throughout the year, students are required to complete 1200 minutes of labs and their accompanying questions. This google sheets allows teachers to monitor students progress to see if they are on track for completion of lab minutes. It calculates the time student have completed and highlights the names of students that are regents ready
Subjects:
Grades:
8th - 12th
Types:
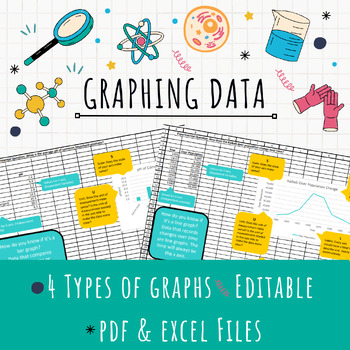
EDITABLE Excel Graphing Template
Teach graphing in Excel with this EDITABLE template! After collecting data, have your students represent it in a formal graph using Excel. This template provides helpful tips for students to determine the right kind of graph (bar, line, or pie) for their data and ALSO teaches them all the important parts of a graph.Assign the template for students to download and edit for a quick graphing solution or provide the pdf handouts for students who just need a little guidance!4 different kinds of graph
Grades:
7th - 12th
Types:
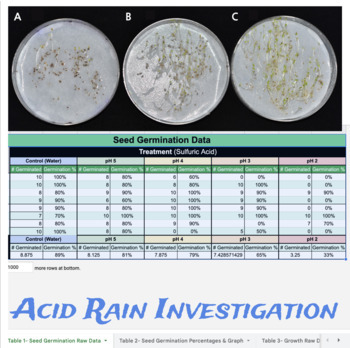
Acid Rain Lab Investigation (A Seed Germination Study)
INCLUDED:Google Doc with Google Sheet Link!Google Sheets with automatically perform ALL calculations and produce graphs! In this lab, students model the effects of acid rain on plant structure and function by studying seed germination in various pH treatments. In this investigation students will expose the seeds to various solutions of acid treatments and document the effects on seed germination. By exposing the seeds to various pH levels in a controlled environment, students can determine at wh
Subjects:
Grades:
7th - 12th
Types:
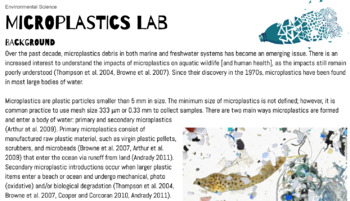
Microplastics Lab (Microscopic Analysis, Chemical Isolation, Food)
This is one of my favorite labs to do with my Environmental Science kids! It has 3 parts: Microscopic analysis of beach sand (you can substitute with any substrate you think might have microplastics!), microscopic analysis of everyday objects (I have my students look at food/snacks that they bring in, and do a dissection of clams/mussels from the grocery store), and chemical isolation/digestion of microplastic-containing samples of muck (we get ours from a pond and a beach). For the chemical dig
Subjects:
Grades:
8th - 12th, Higher Education, Adult Education
Types:
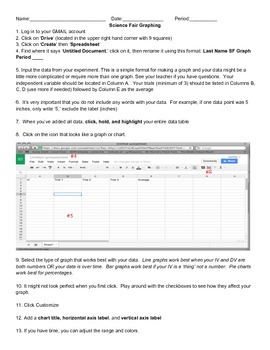
How To Graph Using Google Spreadsheets
This is a step-by-step guide on how to use Google Spreadsheets for students in grades 5-12. Use this as a resource when guiding students through the process. Included with the directions is sample data for students to use when practicing graphing. Perfect for science experiments and science fair!
Subjects:
Grades:
5th - 12th
Types:
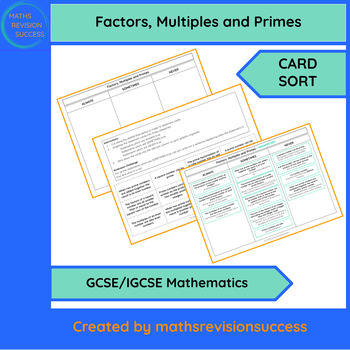
Factors Multiples Primes - Card Sort - GCSE IGCSE Maths
This activity requires students to sort 12 statements about factors, multiples and primes into three categories - always true, sometimes true, never true. This is a fantastic way to deeply assess and challenge students’ understanding of the mathematical content they have studied.Content CoveredThis activity draws on a variety of skills and knowledge from the GCSE and IGCSE curriculum on the topic of factors, multiples and primes.When to use this activityDepending on your students’ level of confi
Grades:
8th - 10th
Types:
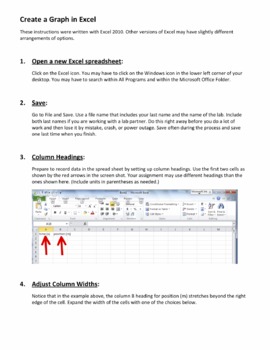
Create Line Graphs in Excel
This instruction guide walks students (and us teachers) through the process of entering data into an Excel spreadsheet and turning it into a line graph. This 10-page guide contains numerous screen shots to help explain each step.
The guide can be used along with laboratory investigations and projects common to physics, chemistry, and biology, as well as courses in mathematics, economics, meteorology, sociology, etc. If your students need to learn how to graph the data they collect, this guide w
Subjects:
Grades:
8th - 12th
Types:
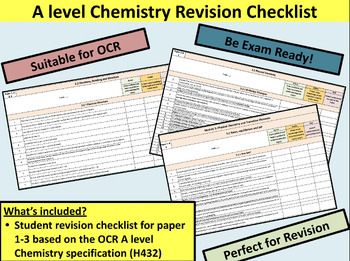
OCR A Level Chemistry Specification Checklist
Student friendly personalised learning checklist for OCR A level Chemistry (H432)This resource includes key specification statements for papers 1-3This resource is one Excel document with tabs for:Module 2: Foundations in ChemistryModule 3: Periodic Table and EnergyModule 4: Core Organic ChemistryModule 5: Physical Chemistry and Transition ElementsModule 6: Organic Chemistry and AnalysisThe exam paper number linked to each topic can be found in the left hand corner of each checklist to aid stude
Subjects:
Grades:
11th - 12th
Types:
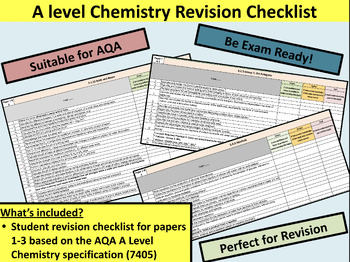
AQA A Level Chemistry Specification Checklist
Student friendly personalised learning checklist for AQA A level Chemistry (7405)This resource includes key specification statements for papers 1-3This resource has ben split into three separate Excel documents for:3.1 physical chemistry3.2 inorganic chemistry3.3 organic chemistryThe exam paper number linked to each topic can be found in the left hand corner of each checklist to aid student exam revision.
Subjects:
Grades:
11th - 12th
Types:
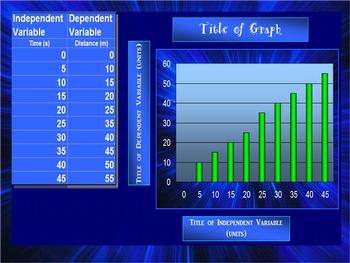
BAR GRAPH (AUTOMATIC)
This spreadsheet allows you to insert your independent and dependent variables into a chart and voila!... a bar graph is generated as you enter in each piece of new data! Students love to take their data from a lab and watch as a graph is made right before their eyes! You can change all of the titles on the chart and the graph to suit your classes laboratory experiment needs! Students can easily print out their data to include in their lab reports!
elementary science class, middle school sc
Grades:
2nd - 12th
Types:
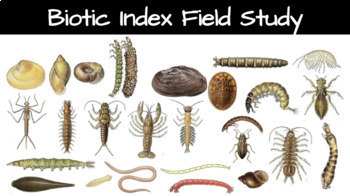
Biotic Index Field Study
In this outdoor Field Study, students compare the ecological health of two freshwater sites based on macroinvertebrate biodiversity found using leaf packs. GOOGLE DOC & easy to use GOOGLE SHEETS INCLUDED!Also includes Quizlet Set and other Resources!STEPS:Collect leaves and place them in a mesh or coconut fiber bundle (leaf pack).Students place the "leaf pack" on the bottom of a freshwater stream.Students will return to the sites to collect the leaf packs after 1-3 weeks. Bins, dissection
Subjects:
Grades:
8th - 12th, Higher Education
Types:
NGSS:
HS-LS2-2
Excel Markbook Template
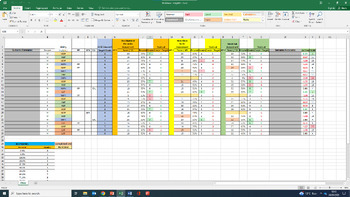
An Excel spreadsheet that can be used for any subject to easily input marks for assessments. The full spreadsheet is on my page.This sheet really saves me a lot of time, and could save you a lot of time too.Key features:Automatically works out percentage, grade, and residual (grade - target grade)Colour coded based on students in the top/bottom 10%Calculates average residual over multiple assessments.Ranks students from highest residual to lowest residual.Displays average residuals for males, fe
Subjects:
Grades:
Staff
Types:
Basic Coding Activity in Excel (LEGO Programming Extension)
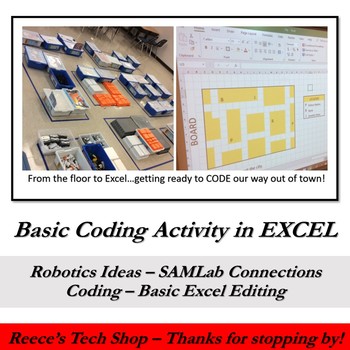
Are you looking for an introductory activity to Coding that can easily be upgraded to extensive coding or robotic programming? This will activity will take you step by step to creating a "city" in EXCEL (we actually recreated the city that we built in our classroom, but you can just create it in EXCEL) and then shows you how to CODE out of the city. With the help of snip tools and pens, you have numerous coding challenges for Warm-Ups or Coding Extensions. Since we actually built the city, st
Grades:
6th - 8th
Types:
Showing 1-24 of 208 results

