34 results
9th grade graphing research
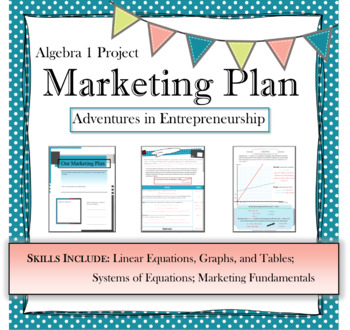
Algebra Marketing Plan PBL | project based learning | real world Math
This Project Based Learning activity will help Algebra 1 students practice setting up and solving systems of linear equations within a real world context. As they take on the role of an entrepreneur, they will write equations, plot coordinate points, graph equations, analyze data, and draw conclusions. This can be used as a group project or individual project and would work great for an end of unit review. ------------------------------------------------------------------------------------------
Subjects:
Grades:
7th - 12th
CCSS:
Also included in: Math Algebra 1 BUNDLE projects, activities, notes, and more
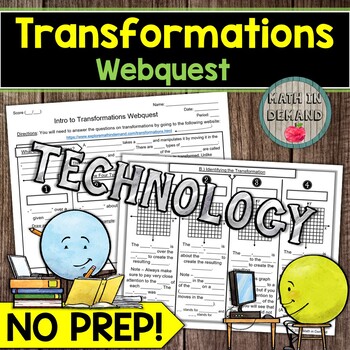
Transformations Webquest Reflection Rotation Translation Dilation
Students will need a device for my math webquest on transformations. Students will be given a link that goes to my website containing information about reflections, rotations, translations, and dilations. Students will learn how to: (1) identify a transformation, (2) perform a transformation, and (3) use the transformation rules to give the coordinates of an image. I have included a worksheet that aligns to the information on my website. All you need to do is print and go! In addition, there is
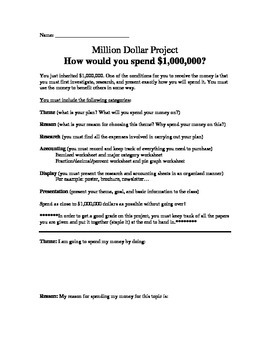
Million Dollar Project (Graphing, decimals, fractions, accounting and percents)
What would you do with a million dollars? How would you spend it?
In this project you've been left a 1 million dollar inheritance. The catch is you must first research and present how you will spend the money.
In the first part of the experiment, the students will fill out an accounting chart, where they will fill out an itemized chart displaying each item they plan on purchasing to complete their million dollar project. They will than be asked to put all those items into major categorie
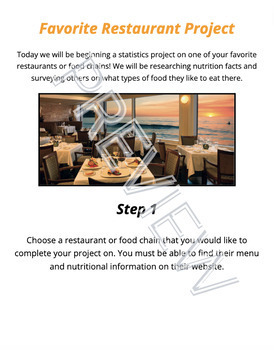
Scatter Plot and Bivariate Data Research Project
Students will begin a statistics project on one of their favorite restaurants or food chains! They will be researching nutrition facts and surveying others on what types of food they like to eat there. Through this data collection they will work on their skills of creating scatter plot graphs, creating relative frequency tables, and analyzing this data. This can be used either by paper or digitally. I used it the last two years during distance learning. Rubric included.
Subjects:
Grades:
7th - 12th
Types:
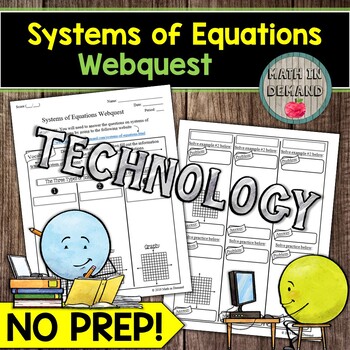
Systems of Equations Webquest Math
Students will need a device for my math webquest on systems of equations. Students will be given a link that goes to my website containing information about the number of solutions (no solution, one solution, and infinitely many solutions), and how to determine the number of solutions by using graphing, substitution, and elimination. I have included a worksheet that aligns to the information on my website. All you need to do is print and go! In addition, there is a 10 problem quiz on my website.
Hurricane Project
This is a great project for students to understand hurricanes to the full extent. We would study hurricanes over a few weeks showing students videos, data, going to the National Hurricane Center website, giving them the opportunity to learn how to plot coordinates and track them. They will understand the damage that can be done and who is called in after a hurricane has hit and the help the city will receive. They will create a hurricane from start to finish, choosing a name based on the month o
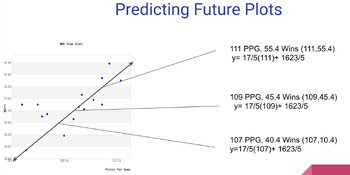
Scatter Plot Project on Desmos with Template
Learners will work to collect their own data from something they are interested in. They will then create a scatter plot using Desmos.com and analyze the information they collected. The analysis includes drawing their own trend line, finding the equation of that trend line, and predicting 3 values outside their original data collection. There are detailed directions with screenshots included along with a Google Slides template that can be shared with learners to help them organize their work. I
Subjects:
Grades:
7th - 9th
Types:

Classroom Stockmarket Challenge Project
This project is a real-life example of using percent of change and graphing. The beauty of this project is that it can be done with computers if available or just paper and pencil. It can be used to teach percent of change, graphing, interpretation of data, finance and business. The project can be used as a blank day (at end of unit) or end of year project. I have used it with 7th grade Advanced Math and 8th graders in Pre-Algebra.Other Projects you may be interested in:Circle Graphs using a Spo
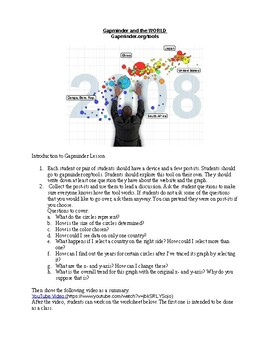
Gapminder and the World Activity
Students use gapminder.org/tools to discover the relationships between various historical factors and the population of many countries over time. This lesson connects history with linear relationships. It is a great way to add context to graphs and help students apply their math knowledge in a unique cross-content way.
Subjects:
Grades:
8th - 12th
Types:
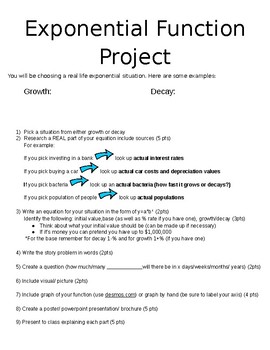
Exponential Function Real Life Project
Students pick an exponential growth or decay situation and research real life rates or values. Furthermore, they create an equation, write a story problem, ask and answer a question, create a graph and present a powerpoint or poster about their exponential situation.
* Note blank space under growth and decay is meant for a whole class brainstorm about the different scenarios they can think of.
Subjects:
Grades:
8th - 12th
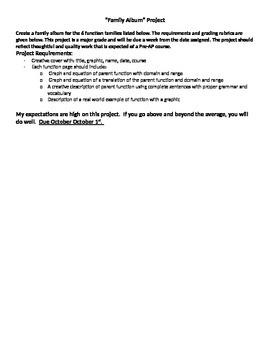
Family Album Project
A project designed to summarize the transformations, characteristics, and domain and range of the parent functions. Allows students to be creative.
Subjects:
Grades:
9th - 12th
Types:
Introduction to Sharks, Skates and Rays
Biology, Marine Biology, Upper Level Elementary ScienceIncluded in the package:- Introduction to Sharks Powerpoint (41 slides)- Shark Anatomy Powerpoint (46 slides)- Cartilaginous Fish (Rays & Skates) (44 slides)- Shark Game Show (Jeopardy style) Review PowerpointTo assess:- Shark Test- Shark Test Study Guide- Shark Test Study Guide ANSWERS- Cartilaginous Fish Quiz - Cartilaginous Fish Quiz ANSWERSStudents Research and Activities:- Shark Species Internet Research Questions- Shark Species Pre
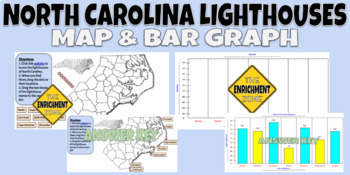
North Carolina Lighthouses Map and Bar Graph
North Carolina's lighthouses are some of the most famous in the world. There are 7 standing lighthouses along the coast of NC and many students may never see them in person. In this resource, students will be able to research where those lighthouses are and how tall they are. What's included:1. Blank map of NC coast and directions for students to go to a website and locate the lighthouses, then come back to the Google Slides and drag the circles/names to the correct location.2. Blank bar graph
Grades:
3rd - 12th
Types:
6 Editable Bar Graph Templates 2.0
Finally a simple and professional graph space that students can fill out without any design issues getting in the way. This file contains 6 ready-to-use graph options. Print them and have students fill them with pencil and ruler, or distribute them over computer and let them practice entering the data. Get a project perfect finish every time. Maybe you just want to fill it out live on a projector? The possibilities are endless! It's okay to say you love these bar graphs. So do we.Contains:- 2 bl
![Preview of Magic School Bus Rides Again *Assessment Package* [Episode 1: INVASIVE SPECIES]](https://ecdn.teacherspayteachers.com/thumbitem/Magic-School-Bus-Rides-Again-Assessment-Package-Episode-1-INVASIVE-SPECIES--3429473-1507989908/original-3429473-1.jpg)
Magic School Bus Rides Again *Assessment Package* [Episode 1: INVASIVE SPECIES]
The Magic School Bus Rides Again
Episode 1 – Frizzle of the Future
Topic: Invasive Species
Assessment Package Includes:
• Teacher’s Guide
• Answer Key
• Student Video Packet:
★ Part 1: Video Assessment
→ Episode Overview to engage students.
→ Pre-Viewing Questions to elicit prior knowledge, preconceptions, and misconceptions.
→ Viewing Questions for students to answer while watching the episode.
★ Part 2: Graphing & Analyzing Data
→ Student
Subjects:
Grades:
7th - 12th
Types:
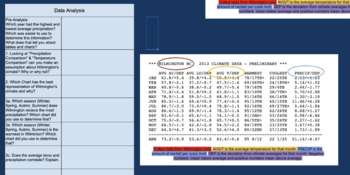
virtual lab collect digital weather data to analyze Climate
Use real data to illustrate weather's relationship with Climate. This data provides the foundation for discussion on the four seasons as well as natural weather events such as hurricanes, El Nino, La Nina, and how it pertains to the North Carolina coast and surrounding states. Each collection, supported by NOAA, provides detail weather data for each month but also a detailed summary of the events from that year. The activity allows for groups or individuals learn the process of collecting month
Subjects:
Grades:
5th - 10th
Types:
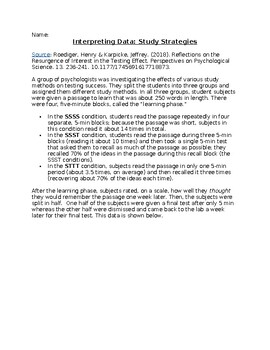
Teach study skills through graphical analysis
Have your students come to their own conclusions about the benefits of retesting over rereading by having them analyze this graph from a 2018 psychology paper. They can practice identifying variables while they compare results, interpret error bars, and apply it to their own study methods.
Subjects:
Grades:
7th - 12th
Types:
Dish Soap Bubble Lab and Class Discussion
This lab can be used in the beginning of the school year to help break the ice in the classroom and to investigate how soap affects the surface tension of water. There will be three different soaps selected by the teacher from the dollar store. There are class discussions, collaborative work and research. Each lab group of three will test the efficiency of each soap by measuring bubbles created with each type of soap and determine which soap makes the best bubbles.
Grades:
6th - 9th
Types:
Hurricane - Task Cards
This set of nine task cards engages students and requires higher-level thinking. Tasks include: writing mock interviews, researching weather related careers, making comparisons between Hurricane Sandy and other known hurricanes, writing poetry, making tables and graphs. The activities are designed for groups/partners to work together to investigate, create, and present information about hurricanes.
If you would like to "Follow Me," you will receive notifications on the TpT homepage when I h
Subjects:
Grades:
4th - 10th
Types:
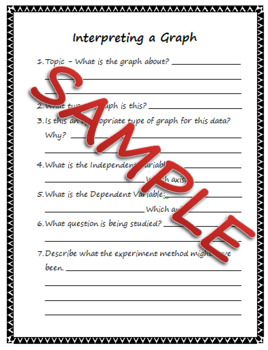
Interpreting a Graph Worksheet
I used this 2-page worksheet with my high school students to interpret graphs and visual data. It goes through all parts of the graph, and asks students to interpret data and trends in the data. Students are asked to describe the scientific method might have been gathered. Students are then asked about implications of the data and how the data might have been used.You will receive a 2-page PDF. If you have any questions - I'd prefer you ask me BEFORE purchasing rather than leaving less than fl
Subjects:
Grades:
7th - 12th
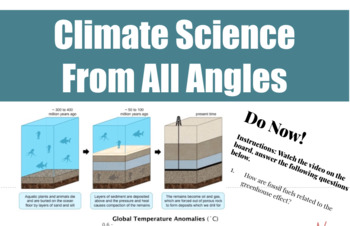
Climate Science From All Angles
Great for remote instruction! Bring your Earth science students' active knowledge of climate to a whole new level with multi-modal activities in "Climate Science from All Angles." These sequenced approaches to building scientific-literacy incorporate current news, graphing, argumentation, and scaffolded methods for writing scientific explanations. Where Science and Literacy Meet! learnmore@stemjourneys.org.
Subjects:
Grades:
5th - 12th, Higher Education, Adult Education, Staff, Not Grade Specific
Types:
CCSS:
NGSS:
MS-ESS3-2
, MS-ESS3-5
, MS-ESS3-3
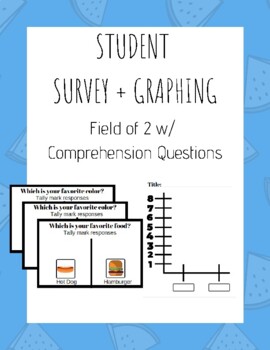
Classroom Social Survey + Graphing (Field of 2 w/ Comprehension Questions)
This set contains materials for your students to socialize and get to know their peers while learning mathematics skills (counting & graphing). This set includes:-IEP Goal Connection-30 prompted survey questions-Blank survey questions-Comprehension Questions-Blank bar graph template Information & Implementation:This set can be used to practice students social skills as well as mathematics skills. -Social: Students are going around the class discussing with peers about their likes & d
Subjects:
Grades:
1st - 9th
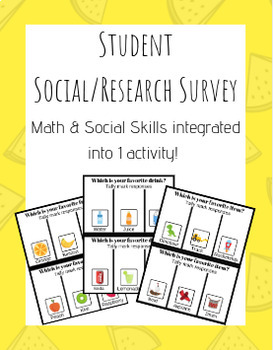
Classroom Social Survey + Graphing
This set contains materials for your students to socialize and get to know their peers while learning mathematics skills (counting & graphing). This set includes:-IEP Goal Connection-30 prompted survey questions-Blank survey questions-Blank bar graph template Information & Implementation:This set can be used to practice students social skills as well as mathematics skills. -Social: Students are going around the class discussing with peers about their likes & dislikes. -Math: Students
Subjects:
Grades:
1st - 9th
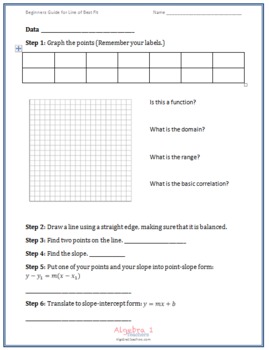
Beginners Guide to the Line of Best Fit
This is a simple one page template, that allows to students (or you) to
-insert data
-graph
-find the slope
-write the equation in point slope form
-convert the equation to slope intercept form
I hope this helps your students write the line of best fit using real world data.
Thank you in advance for your feedback. It is appreciated!
Jeanette Stein
http://algebra1teachers.com
Subjects:
Grades:
8th - 10th
Showing 1-24 of 34 results


