Classroom Social Survey + Graphing (Field of 2 w/ Comprehension Questions)
- PDF
- Easel Activity
Description
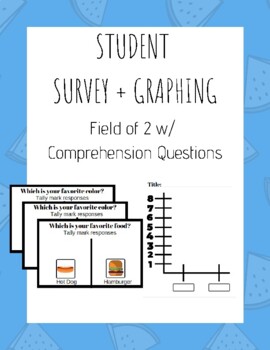
This set contains materials for your students to socialize and get to know their peers while learning mathematics skills (counting & graphing).
This set includes:
-IEP Goal Connection
-30 prompted survey questions
-Blank survey questions
-Comprehension Questions
-Blank bar graph template
Information & Implementation:
This set can be used to practice students social skills as well as mathematics skills.
-Social: Students are going around the class discussing with peers about their likes & dislikes.
-Math: Students are recording their peers responses as data, as well as counting up the total responses by category at the end and creating their own bar graph.
How I implement in my class:
1. Students are to choose a topic to "ask the class" with one of the topic cards provided or they can form their own!
2. Students go around the class with their topic card as well as a pencil, pen or marker and "ask around the class" tally marking each response as data.
3. Students are to make a bar graph with their data that they collected.
4. Students identify who won!
Let me know how it is working in your classroom!
Check out these other learning materials from Functional Learning!
Check out Safety Sign of the Week - Set 1
Check out Safety Sign of the Week - Set 2
Check out Safety Sign of the Week - Set 3
______________________________
Leave a review & get TPT Credit!
Leave a review and/or comment so you can earn TPT credit that you can utilize on future purchases for YOUR classroom!
1. Go to your My Purchases page.
2. Beside each purchase you'll see a Provide Feedback button.
3. After selecting that button you will be taken to a page where you can give a rating and leave a comment for the product.
I really appreciate all the feedback you give me as it helps me find out what is most helpful for you and your students!
Be the first to find out about NEW products & sales!
Click "Follow Me" near the top of the page in my store Functional Learning.
Get connected!
Follow me on Instagram for more product information & A LOT of teacher love, mindfulness & motivation.


