TPT
Total:
$0.00

Classroom Stockmarket Challenge Project

Rated 5 out of 5, based on 2 reviews
5.0 (2 ratings)
;
Lessons by Liz
36 Followers
Grade Levels
7th - 10th, Homeschool
Resource Type
Standards
Formats Included
  • PDF
Pages
17 pages
$5.00
$5.00
Share this resource
Report this resource to TPT
Lessons by Liz
36 Followers

Description

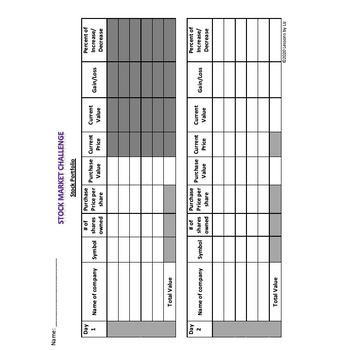
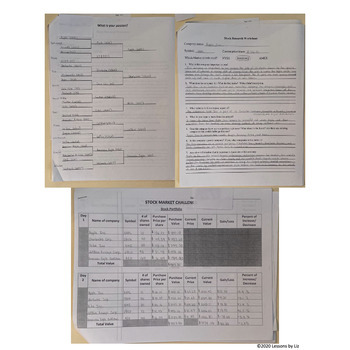
This project is a real-life example of using percent of change and graphing. The beauty of this project is that it can be done with computers if available or just paper and pencil. It can be used to teach percent of change, graphing, interpretation of data, finance and business. The project can be used as a blank day (at end of unit) or end of year project. I have used it with 7th grade Advanced Math and 8th graders in Pre-Algebra.

Other Projects you may be interested in:

Circle Graphs using a Sport Survey

Famous Mathematicians Cube Project

Line Plot & Bar Graph Using Real-Life Data Mini-Project

Conversions and Dimensional Analysis

Perimeter, Area & Volume Hands-on Activity Project

Comics/Funnies - Practice measurement, fractions, scale factor, area & perimeter

CityMaps: An activity for applying Coordinate Plane Knowledge to Maps

Percent Proportion Activity & Quiz

Sale Ads: An activity for applying Percent of Change to Sale Ads

Total Pages
17 pages
Answer Key
N/A
Teaching Duration
1 Week
Report this resource to TPT
Reported resources will be reviewed by our team. Report this resource to let us know if this resource violates TPT’s content guidelines.

Standards

to see state-specific standards (only available in the US).
Find a percent of a quantity as a rate per 100 (e.g., 30% of a quantity means 30/100 times the quantity); solve problems involving finding the whole, given a part and the percent.
Use proportional relationships to solve multistep ratio and percent problems. Examples: simple interest, tax, markups and markdowns, gratuities and commissions, fees, percent increase and decrease, percent error.

Reviews

Questions & Answers

36 Followers