56 results
9th grade graphing simulations
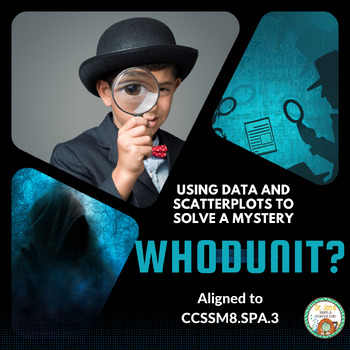
Line of Best Fit and Scatterplots
Who doesn't love a good mystery?!!!! In this engaging students use a real life scenario to apply scatterplot data of shoe size and height and the line of best fit to capture the correct suspect. This product has lots of great reviews! Many middle school math teachers state this was a great way to review the concept of line of best fit and scatterplots. Aligned to CCSSM8.SP.A.2 and CCSSM8.SP.A.3This activity is also available in a bundle at a discounted rate:Scatterplots and Line of Best
Subjects:
Grades:
7th - 9th
Types:
Also included in: Line of Best Fit and Scatterplots: The Bundle
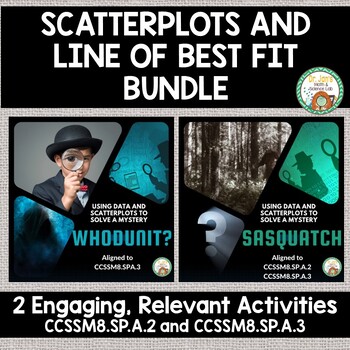
Line of Best Fit and Scatterplots: The Bundle
This bundle includes 2 engaging activities where students can apply the skills of plotting points in a scatterplot, making a line of best fit, and finding the slope of the line to find missing data. Fun scenarios of Sasquatch and a crime scene hook kids into learning. Please leave feedback, you can earn TpT credits for future purchases. If you enjoy these activities consider following my store as I work to increase my middle school math inventory. Check out my other middle school math produc
Subjects:
Grades:
7th - 9th
Types:
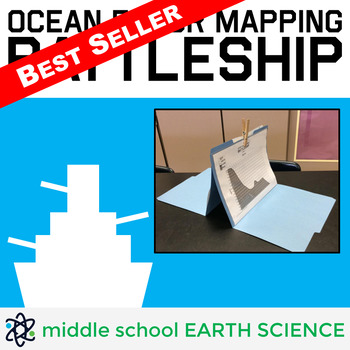
Ocean Floor Mapping Battleship Game
Teacher Review: "My students are obsessed with this activity! They even ask to play during indoor recess!" - Turner's Teaching Troop (January 22, 2020)Ocean Floor Mapping Battleship includes 36 unique maps of the ocean floor, a recording sheet, a detailed lesson plan with suggested pre-game activities, a blank map students can use to draw their own ocean floor, a diagram showing the layers of the ocean, and easy to follow game instructions. Field tested with sixth-graders, this game challenges s
Subjects:
Grades:
5th - 9th
Types:
CCSS:
Also included in: Earth Science Games Bundle
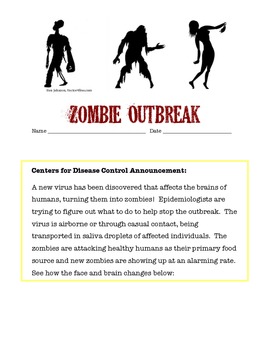
Investigating the Spread of a Viral Outbreak
Students in grades 5 - 9 model the spread of an infectious disease under the entertaining theme of a zombie outbreak. One student unknowingly is patient zero and students simulate the spread of an airborne illness. This highly engaging activity covers health topics, nature of science, and math skills as students graph data in a line plot. Higher level students can be challenged to find the function of the exponential growth of the outbreak.
Subjects:
Grades:
6th - 9th
Scatterplots and Line of Best Fit
This engaging activity allows students to apply their knowledge of slope, scatterplot data, and line of best fit to figure out how tall Sasquatch is. Taking the role of engineers, students use a foot print of sasquatch to approximate his height which is needed to construct a trap. An engaging newspaper article sets the scene of the recent Sasquatch sightings at the local park. This activity is also available in a bundle at a discounted rate:Scatterplots and Line of Best Fit BundleAligned to C
Subjects:
Grades:
7th - 9th
Types:
Also included in: Line of Best Fit and Scatterplots: The Bundle
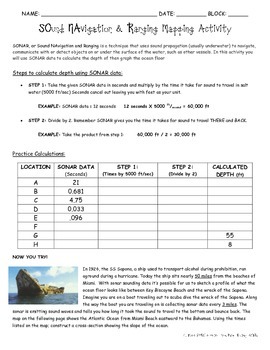
SONAR Calculations and Graphing
In this classroom activity, students are guided through the calculations necessary to obtain ocean depth from SONAR data. Then they use data to complete a profile of the part of ocean floor from which the data came. Please note: this does not show all the parts of the ocean floor. Image and activity where adapted from Naval History STEM H.
Subjects:
Grades:
6th - 12th
Types:
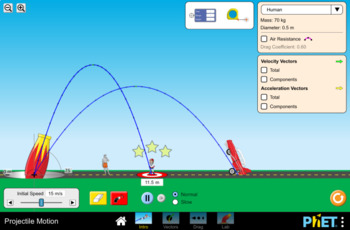
Projectile Motion Simulation Lab- PhET
This handout is meant to accompany the Projectile Motion simulation found here: https://phet.colorado.edu/en/simulation/projectile-motion
45 minute lesson time
This lab can be used to teach a range of concepts such as:
-Relationships between independent/manipulated and dependent/responding variables
-Forces in motion
-Projectile Motion
-The relationship between firing angle and distance traveled
-Graphing independent/ dependent variables
-Creating data tables
Subjects:
Grades:
6th - 12th, Higher Education, Adult Education
Types:
INVESTING IN THE STOCK MARKET : an in-class simulation guide
This is a 29 page package to support teachers in running a 24 day stock market simulation in their grade 5-10 classroom. I have used a version of this in my class for several years now and the kids LOVE it! I have adjusted it and perfected it to include a 24 page student booklet, an evaluation sheet, and a three page SPECIFIC teacher instruction manual.
I offer this exact resource IN FRENCH. Check out La classe de Mme Geneviève for other Math Resources and French Immersion Resources.
Thank
Subjects:
Grades:
5th - 10th
Types:
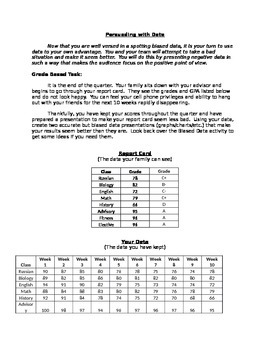
Persuading with Data: Using data bias to your advantage
The activity is designed as a follow-up to my Data Bias activity (posted for free). Student use what they learned about data bias to create data presentations (graphs, charts) that help prove their point. Multiple scenarios are given where students are trying to convince their parents that their grades/behavior aren't bad.
This activity helps students internalize the power of data bias and makes them more likely to look out for this bias in the real world. This makes for a really fun homew
Subjects:
Grades:
7th - 10th
Types:
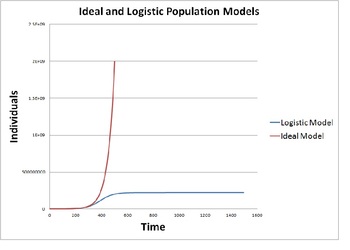
Modeling Population Growth (Ideal vs. Logistic Model)
This activity provides instructions to construct a mathematical model on a blank spreadsheet that simulates population growth using an ideal model and a logistic model. The activity provides background discussion and then gives instructions on how to program a spreadsheet to produce and display the ideal and logistic population models. Their results are studied for various cases including human population, rabbits, polar bears, bacterial and yeast colonies.
This quantitative population model
Subjects:
Grades:
9th - 12th, Staff
Types:
Simulation Classroom Economy Lesson Plan
This lesson plan is for a fifth or possible sixth grade economics unit. The lesson is specially designed to be a part of an economics unit which requires or needs a simulation. The lesson plan includes critical questions, currency template, simulation record sheet and step-by-step instructions on how to set up your classroom. This lesson plan will make your classroom economy simulation meaningful, integrated, value based, challenging and active (MIVCA).
Subjects:
Grades:
4th - 12th, Higher Education
Types:

Teach Students to Make a Survey & Presentation with Google Forms & Slides
Show your students how to create a poll/survey using Google forms. This easy-to-follow slides presentation shows students how to make and customize a survey, make a QR code with a direct link to the survey, and use the results to make a presentation for the class using graphs from their data.
Subjects:
Grades:
5th - 12th
Types:
LA BOURSE : UNE SIMULATION EN CLASSE (Stock Market simulation kit)
This is a 28 page package to support teachers in running a 24 day stock market simulation in their grade 5-10 classroom. I have used a version of this in my class for several years now and the kids LOVE it! I have adjusted it and perfected it to include a 24 page student booklet, an evaluation sheet, and a three page SPECIFIC teacher instruction manual.The entire content is IN FRENCH for the French Immersion--or francophone--classroom. I also offer this exact product IN ENGLISH, if you are int
Subjects:
Grades:
5th - 10th
Types:
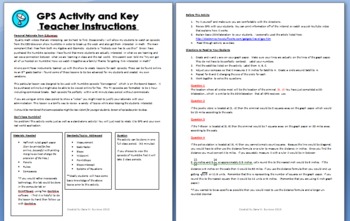
GPS Simulation - Applications of Algebra and Geometry - Aligned with Numb3rs
Are you tired of hearing your students say "When would you ever use this!?" This lesson is a perfect way to silence their complaints!
I originally designed this lesson to be used after watching the episode "Convergence"of the CBS television series Numb3rs. I think every middle/HS teacher should own copies of this series. If you aren't familiar with the show, it is basically a crime show where the characters solve crimes with math. (Similar to CSI) You might be able to download free episodes
Grades:
8th - 12th
Types:
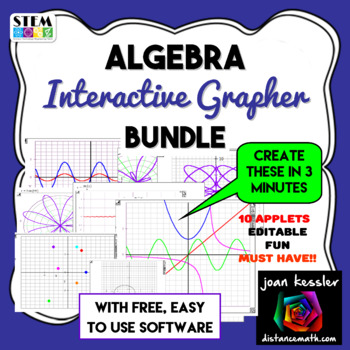
Algebra Interactive Dynamic Easy Fun Graphing App with Editable Templates
Create Cool Graphs easily! No internet needed. No install - even runs from a flash drive. Works anywhere on any PC Computer. Not only can you create interactive dynamic graph for display, you can copy & paste the graphs into a test or handout.Great for Algebra, PreCalculus, and Trigonometry. You will love this!!! This resource is an amazing addition to all of your your Algebra based classes, Algebra 1, Algebra 2, PreCalculus or College Algebra and great for explorations! Create Inter
Subjects:
Grades:
8th - 11th
Types:
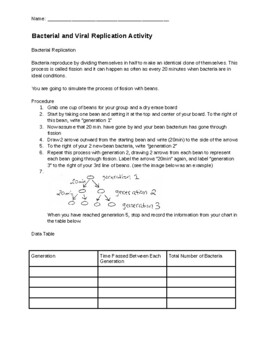
Bacterial and Viral Replication Lab
This lab requires you to have raw beans (any kind to model bacteria) and whiteboards for students to draw a family tree and write out generation numbers next to each bacterial generation. (You could also do this on paper.)This lab is a great way for students to simulate bacterial and viral reproduction. For the bacteria, students will model the number of bacteria in each generation starting with only one bacterium (represented by a bean). With each generation, students will watch as the family t
Subjects:
Grades:
8th - 9th
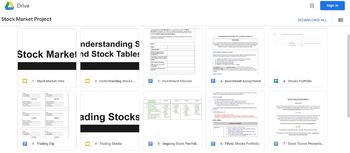
Stock Market Simulation Project, Grade 7 Math, PBL Extended Project
Everything you need to run a stock market simulation project with your class. I used this with grade 7 students, but could be used or modified for a range of grades. Students will learn what the stock market is and how it works, make their own informed stock purchases, and then make trades with each other to simulate the stock exchange in your classroom over several class periods. They will be required to record and track their data in multiple ways and reflect on what they learned at the end. I
Grades:
7th - 10th
Types:

Population Growth of Bacteria
In this activity, students will work with exponential growth of bacteria. This is practice in working with this type of growth and will help students recognize the importance of treating bacterial infections immediately. It is suggested that students work in pairs or small groups to do this activity. After time is given, the answers should be checked to insure accuracy.
Grades:
7th - 9th
Types:
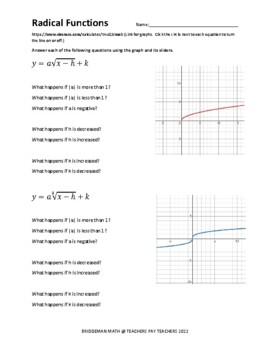
Graphing Radical Functions on Desmos
Introduction to radical functions that allows students to manipulate the parent graphs to see the effects of changing a, h, and k.
Subjects:
Grades:
9th - 12th
Types:
CCSS:
Systems of Equations: Finding Buried Treasure with Solutions
This engaging activity gives students the opportunity to practice graphing and solving systems of equations in a fun way. Students work to find 3 "buried treasures" based on information they are given about people walking or riding to meet at the buried treasure location. Graphing lines, writing equations for lines, and finding solutions to systems of equations are all skills they will practice with this activity. Answer keys included.
Please leave feedback and if you like this product con
Grades:
7th - 9th
Types:
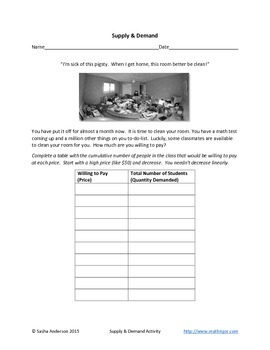
Supply and demand
A classroom activity where student build their own demand and supply curves based on what they are willing to pay (or be paid) for a clean room. Students must reason quantitatively and use units common in economics to solve problems in market equilibrium. Algebra- linear equations, systems of equations, and functions.
Subjects:
Grades:
9th - 12th, Higher Education, Adult Education
Types:
CCSS:
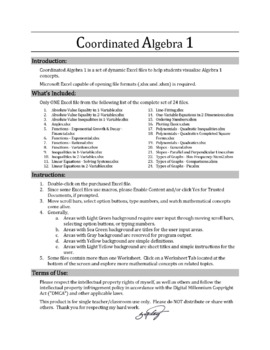
Demonstrate Line Fitting with an Animated Excel File
Simple to use animated Excel file for in class demonstration of Line Fitting using linear regression. Move scroll bars, select option buttons, type numbers, and watch these mathematical concepts come alive. You must use Microsoft Excel that is capable of opening file formats in either .xlsx or .xlsm.
Subjects:
Grades:
9th - 12th
Types:
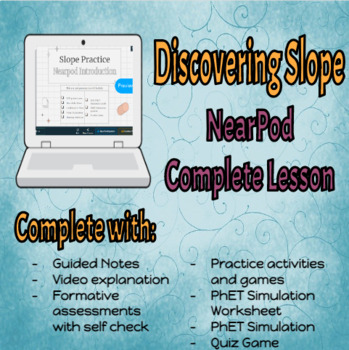
NearPod Slope Lesson
This is a fully ready NearPod lesson about finding slope. This gives a general overview of slope with graphs, 2 points, and standard form. NearPod allows teachers to teach in a whole group setting or give to students as a stundent-paced lesson. This NearPod comes with a guided notes page, broken down notes, practice activities with self-check, practice problems, and a PhET simulation for exploration. You can delete activities your students do not need or add a quiz at the end for a grade.
Grades:
8th - 9th
Types:
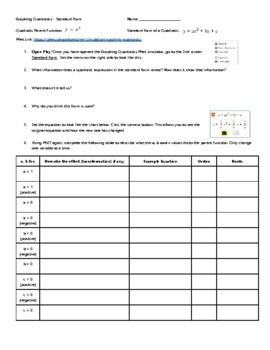
Phet Quadratics Standard Form
Using PhET, students will inquire the components of the standard form equation and graph them. This is an inquiry activity.
Grades:
8th - 12th
Showing 1-24 of 56 results


