66 results
Statistics activity interactive whiteboards
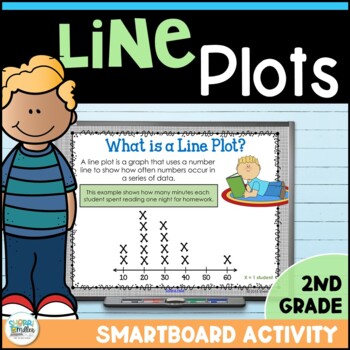
Line Plots Graphing Smartboard Digital Lesson & Student Booklet
Line plots can be a difficult concept for students. This Smartboard lesson and printable booklet will provide you and your students with several activities to practice creating line plots and answering questions about them. The student booklet will keep students engaged during the lesson! You must have Smart Notebook software to open this file. You may also be interested in these other resources:Measurement Digital Escape Room - Escape the Spaceship using Google Apps Geometry Angles Digital Es
Subjects:
Grades:
4th - 5th
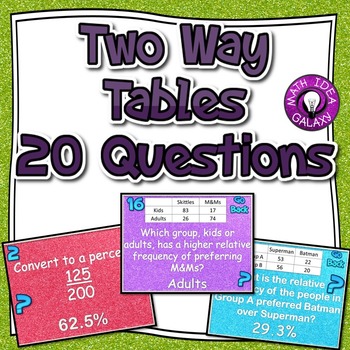
Two Way Tables 20 Questions for Interactive Whiteboard
This is an engaging class activity to review concepts related to reading two way tables. The whole class will answer 20 questions and try to figure our a secret picture at the same time.
This resource includes:
-Game board for projector
-Student scorecard
-20 content questions
-A secret character
-20 questions to help reveal the secret character
Subjects:
Grades:
6th - 8th
CCSS:
Also included in: Two Way Tables Activities Bundle

Guerre des clans!
Plongez-vous dans l'excitation d'un jeu télévisé avec cette adaptation palpitante du célèbre Duel de Questions ! Dans ce jeu interactif, deux équipes s'affrontent pour trouver les réponses les plus populaires à une série de sondages. Vous recevrez un fichier PowerPoint contenant 25 sondages, chacun présenté sous forme de rectangles bleus à cliquer pour révéler les réponses. ATTENTION! Assurez-vous d'avoir les feuilles de réponses des sondages à portée de main pour ouvrir les bonnes cases !Règles
Subjects:
Grades:
Not Grade Specific
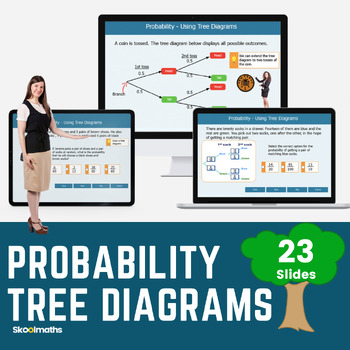
Probability Tree Diagrams Interactive Digital Resources CCSS.7.SP.C.5
Probability Tree Diagrams Interactive Lesson and Activities CCSS.7.SP.C.5Engage your middle school math class with this amazing interactive lesson plan which is focused on teaching probability tree diagrams, aligned with the Common Core State Standard 7.SPC.5. It includes self-marking activities and instructions designed to help middle school students understand and apply the concept of probability through tree diagrams. The interactive elements involve hands-on activities, digital simulations,
Subjects:
Grades:
7th - 8th
Also included in: High School Statistics and Probability Bundle
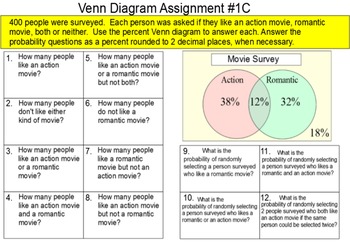
Venn Diagrams with Probability, 2 Lessons + 16 Assignments for SMART
Included in this zip folder are 19 SMART Notebook files. 2 are for instruction, 1 is a student reference handout and 13 are assignments. A brief description of each:
Instruction file #1 is a 36 slide introduction to reading a Venn diagram. Some formative assessment problems are included.
Instruction file #2 is a 25 slide introduction to the complement of a set in a Venn diagram.
Assignment A is a matching assignment. The student matches 10 2 circle Venn diagrams with union, intersection and
Subjects:
Grades:
8th - 11th
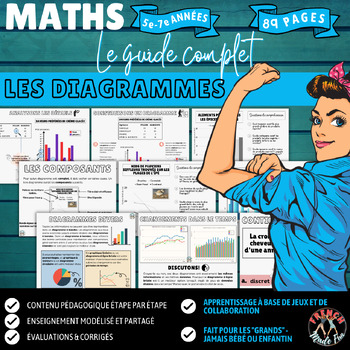
FRENCH MATHS | SANS CAHIER/PAPERLESS | DIAGRAMMES/CHARTS | REPRESENTATION
Having trouble visualizing how to "break down" math concepts and how to structure your teaching? New to this grade level or unfamiliar with "how" to teach it? Tired of passing out worksheets? If you're wanting to try something else to see if your students become more engaged and confident in math... Look no further. No book? No problem. Printer broken? No problem. Multi-levelled or split classrooms? No problem.Imagine math classes that require zero prep, zero paper, zero planning, and slides whi
Subjects:
Grades:
5th - 7th
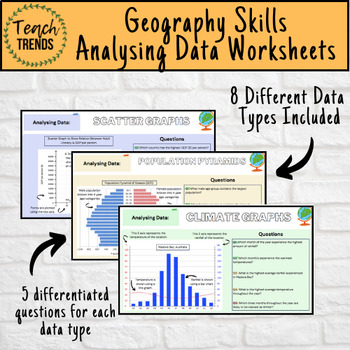
Geography Data Analysis Skills Work Booklet / Activities
Enhance your pupils’ geographical skills with a series of interpretation and analysis sheets and questions. This resource includes 8 PDF slides with corresponding questions all focused on a different data presentation method. Ideal for preparing your pupils for exams and revising analysis skills. The high quality slides include annotations, examples and five scaled-ability questions.The data presentation skills included in this resource are:Climate GraphsPopulation PyramidsChoropleth MapsScatter
Subjects:
Grades:
8th - 12th, Adult Education
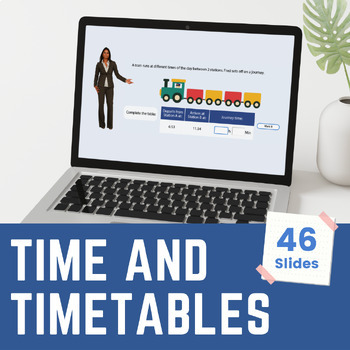
Sixth Grade Time and Timetables Digital Math Lesson and Activities
Sixth Grade Time and Timetables Digital Math Lesson and ActivitiesTeach your math class about tables and timetables with this amazing bundle of interactive self-marking activities.In this lesson, learners will be able to:look at different ways of writing time e.g. 12- and 24- hour clockexplore different units of timeextract information from a simple timetablecalculate time problem in context, including length of time of journeys.The lesson can be used as whole class teaching by teachers and at h
Subjects:
Grades:
5th - 6th
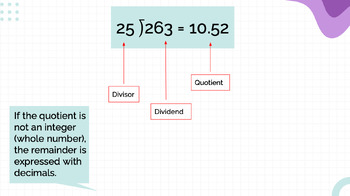
Order of Operations, Multiplying Decimals, Remainders, Graphs, Google Slides
Google Slides for different math topics: - Order of Operations (examples, breakdown of order) - Multiplying Decimals (Step by step guide and examples to practice)- Dividing Natural Numbers with a Decimal Remainder- Statistics (how to make a survey question, organize into data table, features of a graph, average problem)
Subjects:
Grades:
2nd - 8th
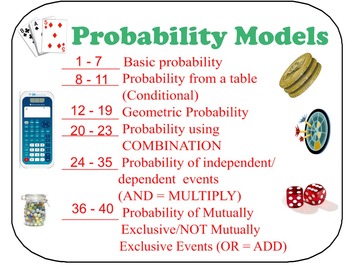
BUNDLE *** FCP, Perm, Comb, & Probability Models Lessons & Exit Ticket
BUNDLE of:
Exit Ticket on FCP, Permutation, & Combination
FCP, Permutation, and Combination - PDF 36 problems
FCP, Permutation, and Combination - Smart Notebook 36 problems
Probability Models - Power Point illustrated models
Probability Models - PDF 40 questions
Probability Models - Smart Notebook 40 questions
Visual Representation of Standard Deck of Cards
For more details, please check the individual description of those items.
Separately, these would cost more than $12.99
☺Would love
Subjects:
Grades:
6th - 12th, Higher Education, Adult Education
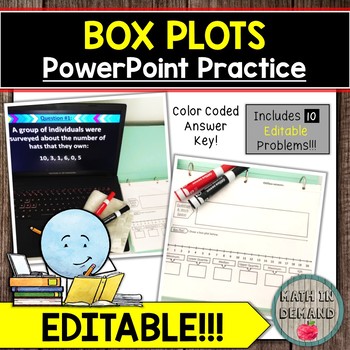
Box and Whisker Plots PowerPoint Practice EDITABLE Distance Learning
This resource includes an EDITABLE PowerPoint file on box and whisker plots. There are 10 problems which you can add, delete, or change! There is a reusable sheet that can be used for any problems involving box plots. You can laminate it or place it in a sheet protector. The PowerPoint has an answer key that is color coded and animated.
Subjects:
Grades:
6th - 7th
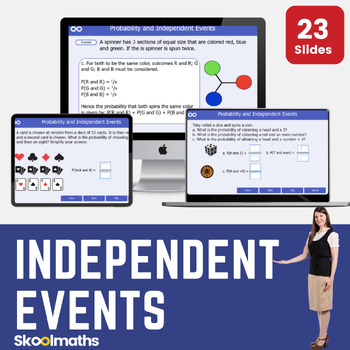
Probabilities | Independent Events Interactive Digital Lesson and Activities
Probabilities | Independent EventsIndependent events are those events whose occurrence is not dependent on any other event. Teach your learners to understand this important concept in statistics and probability with our amazing interactive probability lesson that will teach your Middle school class how to determine the independence of events and how to apply the rule of product to calculate probabilities.By the end of this unit, learners will be able to:Understand the concept of probability and
Subjects:
Grades:
7th - 8th
Also included in: High School Statistics and Probability Bundle
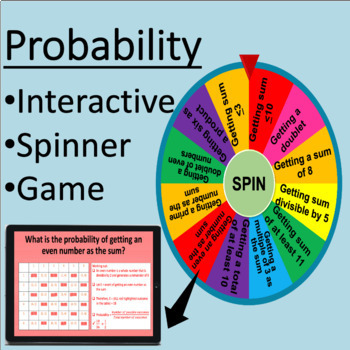
Probability Interactive Spinner Game-No Prep Print Needed, Everything Included
Searching for a fun way for your students to review probability? This interactive probability spinner game is excellent for teaching, reviewing, or even assessing probability understanding for year 5 and year 6 students! Students will calculate the probability of a spinner using table representations, probability fractions and formula calculations. Students will tap on the digital spinner and will be required to tap again for the spinner to land on a random probability question. After attempting
Subjects:
Grades:
5th - 6th
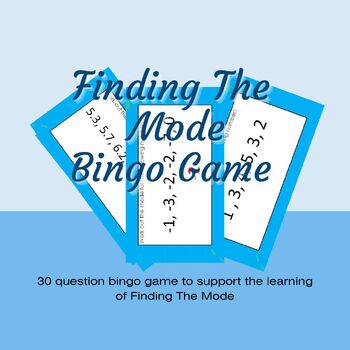
Finding The Mode Maths Bingo Game Activity
OverviewFinding The Mode Maths Bingo Game is an engaging PowerPoint downloadable game/activity designed to help students revise the math topic of finding the mode from a set of data. With 30 adaptable questions and answers included, this game encourages active participation and critical thinking. Students pick 9 numbers at the beginning, and the teacher projects the PowerPoint game, creating an interactive and enjoyable revision session.PowerPoint StructureSlide 2 Table of 30 Answers A table fea
Subjects:
Grades:
Not Grade Specific

Mean, Mode, Median and Range Millionaire
Revise the concept of mean, mode, median and range in a fun and engaging manner. Complete with starter, full millionaire game and plenary. Complete with sound effects and animations this game is sure to engage your pupils the entire lesson. Can be used as a whole lesson or part of a lesson.
Subjects:
Grades:
5th - 10th
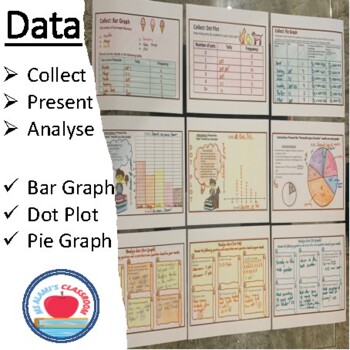
Data + Collect. Present. Analyse + Bar Graph. Dot Plot. Pie Graph.
Looking for a sequenced resource to review data analysis/ interpretation with your students? This hands-on resource structures students understanding of data collection, presentation, and analysis. Firstly, students will revise the key terminology of data analysis including range, minimum & maximum, mean, median, mode by playing with the interactive spinner. Students will tap on the digital spinner and will be required to tap again for the spinner to land on a random data analysis question.
Subjects:
Grades:
5th - 6th
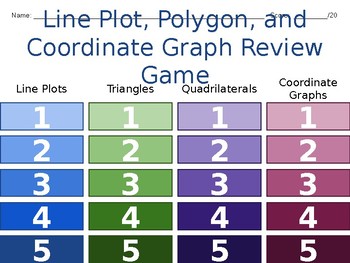
5th grade Line Plot, Triangles, Quadrilaterals, and Coordinate Graph Review Game
A 20-question review game with 5 questions about line plot data (involving fractions, median, mode, range, outliers), 5 questions about classifying triangles (based on angles and side lengths), 5 questions about classifying quadrilaterals, and 5 questions about coordinate graphs.
Slides are linked to show the answer next and then to return back to the choice menu. Answer slides have detailed explanation to help reteach students who missed the question.
This can be played as a large group or st
Subjects:
Grades:
5th
Histograms Smartboard Lesson Data Displays Graphs Graphing
TERRIFIC Histograms-Smartboard-Slides-Lesson covers what a Histogram is, what they look like, features specific to Histograms, and lots of interactive practice for students to create Histograms and be able to read Histograms and find answers. This smartboard lesson also combines activities to practice Histograms. Your students will LOVE learning about Histograms with this Smartboard Lesson. You'll use this year after year to teach Histograms. Created by Tricks and Treats for Teaching. WARNING: Y
Subjects:
Grades:
4th - 6th
Categorical Data Smartboard Slides Lesson Displaying Analyzing Organizing
Categorical-Data Math Smartboard-Slides-Lesson covers the TEKS for 6th grade Math specific to this skill. Lots of great examples and teaching, along with interactive practice for your students. You'll LOVE this resource and use it year after year! WARNING: You MUST have SMART Technologies SMART software, and a SMARTBOARD to teach from, to effectively download, open and use this Interactive Smartboard Lesson. Go to https://legacy.smarttech.com/en/products/education-software/smart-learning-suite/
Subjects:
Grades:
5th - 8th
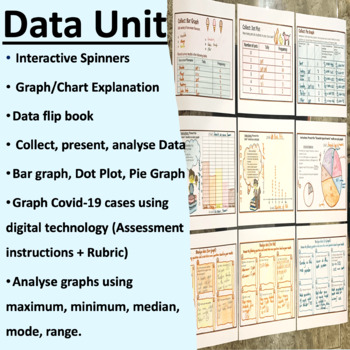
Graphing and Data Analysis Unit for years 5 and 6 (Collect. Present. Analyse)
By purchasing this bundle, you will save 10% off individual resources! Interactive data spinner game included to teach, review, or even assess data understanding for year 5 and year 6 students!Included: + Formative assessment of data through a brainstorm activity+ Data Display Interactive Spinner Game (12 Graphs/Charts)+ Detailed explanation of answers to the spinner questions (Graph/Chart features and characteristics outlined)+ Student booklet included with worksheets+ PowerPointTM presentation
Subjects:
Grades:
5th - 6th
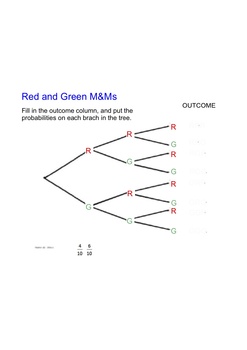
Christmas MMs probability task: Smart Notebook
I use this lesson with my Yr 8 class at Christmas time and they love it! It begins with a game with each student having a cup and 10 m&ms. It is rich in mathematical concepts, but you can bypass these and just focus on the repeated trials and using tree diagrams. The task can be used in higher levels to teach binomial probability and distribution, replacement vs non-replacement, multiplication rule etc. I use packets of red and green m&ms which are available at this time of the year, bu
Subjects:
Grades:
7th - 12th
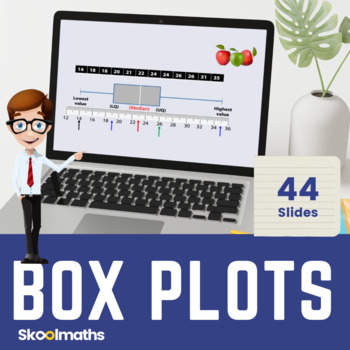
Box and Whisker Plots Digital Lesson and Activities for Middle School
Box and Whisker Plots Digital Lesson and Activities for Middle SchoolBox Plots is a completely interactive lesson designed for Middle school to High School Statistics and Probability.Contents:This bundle pack contains:44 interactive slides with dynamic graphics that will engage your studentsInteractive Drag and Drop activities on find averages as well as instant learner feedbackPrintable Worksheets with answers includedDifferentiated questions and answersCan be used as Home Learning Resource and
Subjects:
Grades:
6th - 9th
Also included in: Complete Statistics and Probability Bundle | Digital and Print
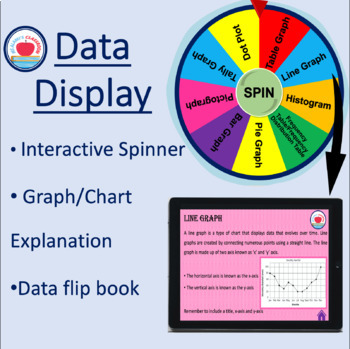
Data Display interactive spinner, Graph/Chart Explanation and Data Flip Book
Searching for a fun way for your students to review data? This interactive data spinner game is excellent for teaching, reviewing, or even assessing data understanding for year 5 and year 6 students! Students will tap on the digital spinner and will be required to tap again for the spinner to land on a random data graph/ chart type. This game is fun and engaging, while offering valuable practice with these essential skills. Click on the preview to watch a video of data display game in action! In
Subjects:
Grades:
5th - 6th
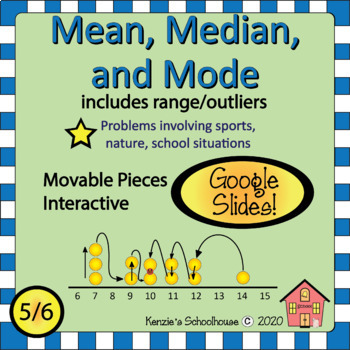
Mean, Median, Mode, and More!
This resource for Google Slides contains instructional interactive activity slides covering mean, median, mode, outliers, and range. These data concepts are taught in the context of sports, nature, and school experiences. The slides are cumulative and reinforce concepts on previous slides.
Subjects:
Grades:
5th - 7th
Showing 1-24 of 66 results


