97 results
7th grade graphing research for GATE

Valentine's Day Heart Candy Stacking STEM Challenge
Valentine Day Heart Candy Stacking STEM Challenge❤️ will get your students collecting data, averaging, analyzing data, and graphing during the holiday. ⭐This activity can also be used for STEAM Activities, STEM After School Programs, Summer Programs, Clubs, Maker Spaces, or at home. ⭐This product is included in my STEM BUNDLE #2 Challenge! ⭐Other Products you might like:➩STEM Challenges For the Whole Year Bundle➩Back to School STEM Challenge➪STEM Waterbottle Challenges➩STEM Valentines Day Chal
Subjects:
Grades:
3rd - 7th
Types:
Also included in: STEM Challenges Entire Year includes End of the Year STEM Activities
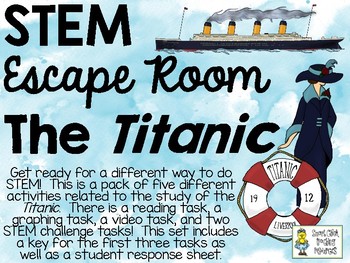
STEM Escape Room - The RMS Titanic
This STEM Escape Room Challenge is a set of five tasks for students to complete. There are a lot of different ways you can complete these five tasks. We do all five tasks over the course of a Friday afternoon in our classroom, or over a span of about 2 hours. You could also do these over the course of 2-3 class periods and students can pick up where they leave off each day. Student teams work at their own pace, they must complete the tasks in order and complete each task before they can move
Subjects:
Grades:
3rd - 7th
Types:
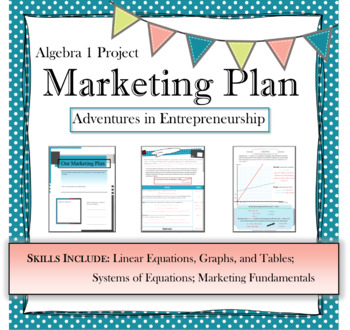
Algebra Marketing Plan PBL | project based learning | real world Math
This Project Based Learning activity will help Algebra 1 students practice setting up and solving systems of linear equations within a real world context. As they take on the role of an entrepreneur, they will write equations, plot coordinate points, graph equations, analyze data, and draw conclusions. This can be used as a group project or individual project and would work great for an end of unit review. ------------------------------------------------------------------------------------------
Subjects:
Grades:
7th - 12th
CCSS:
Also included in: Math Algebra 1 BUNDLE projects, activities, notes, and more
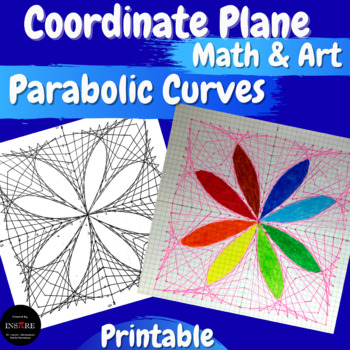
Coordinate Plane Graphing Parabolic Curves Math & Art 4 Quadrants String Art
Geometry Math Project - Practice ordered pairs plotting by using this fun activity. Make beautiful parabolic curves by drawing a series of straight lines.It's a great activity for the First Days of School, Back to School, Summer Camp, Summer School, or End of the Year.Can we draw a beautiful picture using only straight lines? Yes, we can. Check out this math & art project.Why do students love mystery picture graphing? They love discovering the next parts of the picture and guessing what it w
Subjects:
Grades:
6th - 9th
Types:
Football Stats Math Project - Upper Elementary Math: Graphing and Analyzing Data
This Football Stats Project incorporates the use of line plots, stem and leaf plots, analyzing upward and downward trends in data and median, mode, range and outliers. I also incorporated discussion and higher order thinking skills. Students will apply these concepts and skills to football statistics that they will research - included are suggestions for websites to research and topics to research.This would be best for 4th, 5th or 6th grade math students.This resource includes slides that intro
Create a Survey - Research Skills
Scaffolded printables to guide every step of the survey process! Can be used for ANY survey design. Designing a survey is an exciting way for students to conduct research and discover information about a group of people. Throughout the survey process, students have an opportunity to be creative, engage in problem solving and develop critical skills in analytical thinking. A powerful data-gathering tool, surveys are a thought-provoking and dynamic method of research that students love to engage
Subjects:
Grades:
5th - 8th
Types:
Iditarod Student Packet - Daily Tracking (Data Collection, Map Skills, Research)
Iditarod Student Packet - Daily Tracking (Data Collection, Map Skills, Research)This is the page for the previous OLDER version. If you purchase this product you are buying an older version.Click on the link below to be directed to the NEWER, UPDATED, EDITABLE version of this product:https://www.teacherspayteachers.com/Product/Iditarod-Student-PktDaily-Tracking-UPDATE-Data-CollectionMap-SkillsResearch-9140503This is a great resource for students who are interested in learning more about The Last
Subjects:
Grades:
3rd - 7th
Types:
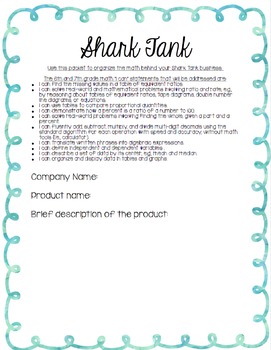
Shark Tank Project
Based on the hit show Shark Tank, students will create a product and business plan to pitch to the "Sharks". This product comes complete with the student packet, certificate for students, questions/script for the sharks, and teacher hints for how to make this a hit!All tasks within the project are connected to 6th and 7th grade CCSS math standards. "I Can" statements are provided in the student packet.Students will:-Create a company name and product-Determine the cost per product to make-Determi

Statistics Survey Project - Project Based Learning (PBL) with Math
Watch your students dive into the world of math as they create, execute, and analyze their own survey! Students will demonstrate mastery of data gathering, survey sampling, developing appropriate survey questions, data tables, Direct Variation, discrete graphs, dot plots, box and whisker graphs, and calculating the inter-quartile range.The Unique Survey Project is highly engaging, capitalizing on the innate curiosity of the adolescent mind. You will love the low-prep instructional guide. Your st
Subjects:
Grades:
6th - 10th
Types:
Also included in: Fun with Ratios Activities Bundle - 7th Grade PBL with Math
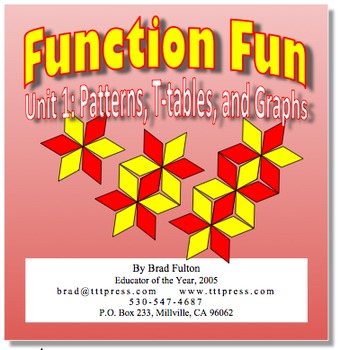
Function Fun, Unit 1: Patterns, T-tables, and Graphs
OVER 50 PAGES! These are the best strategies for teaching linear functions to all students. Tested in grades 4 through high school, this unit helps students develop competency with both the concepts and computations involved in functions. The multi-representational activities cover slope, y-intercept, t-tables, graphs, formulas, and visual representations of linear functions.This unit is part 1 of a four-part series and includes 17 patterns in both color and black and white versions to provide t
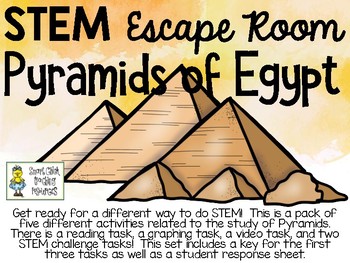
STEM Escape Room - PYRAMIDS of EGYPT
This STEM Escape Room Challenge is a set of five tasks for students to complete. There are a lot of different ways you can complete these five tasks. We do all five tasks over the course of a Friday afternoon in our classroom, or over a span of about 2 hours. You could also do these over the course of 2-3 class periods and students can pick up where they leave off each day. Student teams work at their own pace, they must complete the tasks in order and complete each task before they can move
Subjects:
Grades:
3rd - 7th
Types:
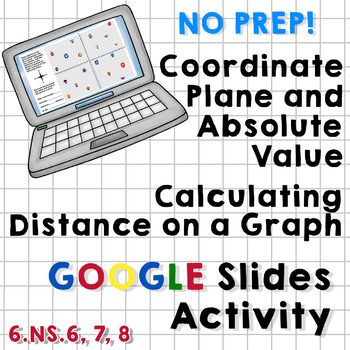
Coordinate Plane/Absolute Value/Distance on a Graph Google Slides Activity
This Google Slides Activity includes 14 slides containing basic reminders about the setup and use of a coordinate plane, calculating distance on a graph using absolute value, and describing directions as they relate to crossing over the axes.Students are asked to find the coordinates of several locations in "Grid Town" and then to describe the number of "city blocks" needed to travel to get from one destination to another. They are asked to use directional words (north/south/east/west) and dete
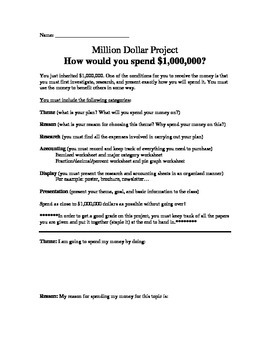
Million Dollar Project (Graphing, decimals, fractions, accounting and percents)
What would you do with a million dollars? How would you spend it?
In this project you've been left a 1 million dollar inheritance. The catch is you must first research and present how you will spend the money.
In the first part of the experiment, the students will fill out an accounting chart, where they will fill out an itemized chart displaying each item they plan on purchasing to complete their million dollar project. They will than be asked to put all those items into major categorie

Easy Chemistry - atoms, elements, and molecules
This is a beginners unit that introduces elementary students to chemistry basics. It covers atoms, elements, molecules, the periodic table, and Mendeleev. This unit uses backwards learning in that the students do the fun activities and then use critical thinking skills to relate their learning back to chemistry fundamentals. I used this unit with my fourth and fifth grade Gifted and Talented students and they loved it. Their learning was much deeper due to the activities which include block
Subjects:
Grades:
5th - 7th
Types:
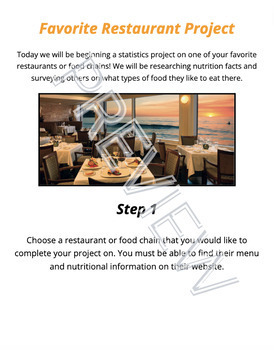
Scatter Plot and Bivariate Data Research Project
Students will begin a statistics project on one of their favorite restaurants or food chains! They will be researching nutrition facts and surveying others on what types of food they like to eat there. Through this data collection they will work on their skills of creating scatter plot graphs, creating relative frequency tables, and analyzing this data. This can be used either by paper or digitally. I used it the last two years during distance learning. Rubric included.
Subjects:
Grades:
7th - 12th
Types:
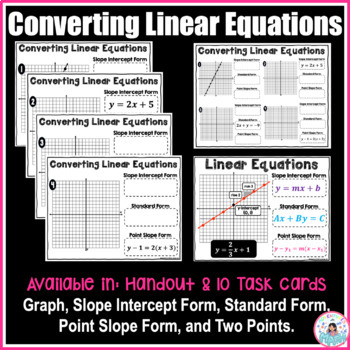
Converting Linear Equations: Slope Intercept, Standard, Point Slope, Two Points
The activity has 10 linear equations task cards. Students are only given one form in each problem (graph, slope-intercept form, standard form, point-slope form, or two points), and they are expected to determine the other forms.One version is the full-size page (one problem on one page). This can be done as task cards seated as partner work, or in small group centers.The other version is a handout, meaning there are four problems on one page. This would be great as a homework assignment after l
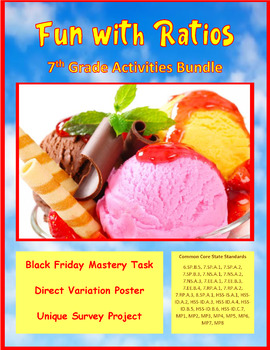
Fun with Ratios Activities Bundle - 7th Grade PBL with Math
The purpose of the Fun with Ratios Activities Bundle is to give students the opportunity to use creativity to apply ratios, proportions, and percentages in real-world settings. This bundle includes three unique tasks: Black Friday Mastery Task, Direct Variation Poster Mastery Task, and the Unique Survey Project. These activities and their accompanying materials are suited for students in grades 7 through 9. These lessons make excellent sub plans. Each project takes approximately two 60-minute bl
Subjects:
Grades:
7th - 9th
Types:
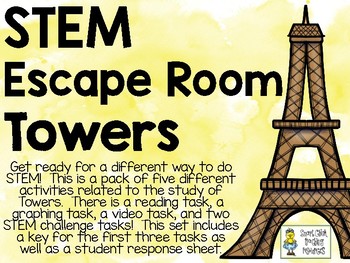
STEM Escape Room - TOWERS
This STEM Escape Room Challenge is a set of five tasks for students to complete. There are a lot of different ways you can complete these five tasks. We do all five tasks over the course of a Friday afternoon in our classroom, or over a span of about 2 hours. You could also do these over the course of 2-3 class periods and students can pick up where they leave off each day. Student teams work at their own pace, they must complete the tasks in order and complete each task before they can move
Subjects:
Grades:
3rd - 7th
Types:
Weather Tracking in Excel
Compatible with Google Sheets, Google Classroom, or as a stand-alone file on a PC, this product is a must have for any teacher comparing weather conditions in multiple locations!
BEFORE YOU BUY: This file is part of a larger unit. Save yourself money by purchasing the Super Science Set for Weather and Climate nstead of buying each file separately.
Purchased alone, you get:
⭐ An Excel workbook that enables students to track the weather for 5 different locations as a whole class or individ
Subjects:
Grades:
4th - 8th
Types:
Milk Carton Apartments
An inexpensive and easily implemented hands-on lesson helps students understand functions and function notation. Concepts include slope, y-intercept, t-tables, graphs, direct and indirect variation, and the identity function. Common Core alignment is included along with complete instructions, activity masters, answer keys, and research tips. You'll even get an "udderly' silly trivia quiz about milk to amuse your students.
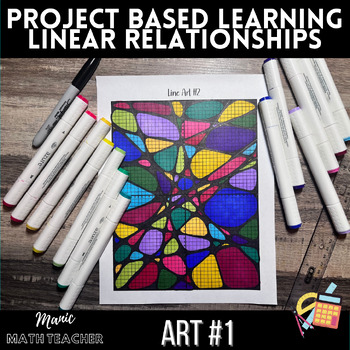
Linear Relationships Art #1 - Graphing Straight Lines - Project Based Learning
Linear Relationships Art #1 - Graphing Straight Lines - PBL, Project Based LearningThis math art project embodies the principles of project-based learning, merging mathematics with artistic expression to engage students in a multifaceted educational experience. Students will graph 18 linear equations, meticulously tracing each line then creating intricate oblong shapes within spaces created by the lines. The project culminates in a vibrant display of color as students fill in each unique shape,
Subjects:
Grades:
7th - 11th
Types:

Hurricane Project
This is a great project for students to understand hurricanes to the full extent. We would study hurricanes over a few weeks showing students videos, data, going to the National Hurricane Center website, giving them the opportunity to learn how to plot coordinates and track them. They will understand the damage that can be done and who is called in after a hurricane has hit and the help the city will receive. They will create a hurricane from start to finish, choosing a name based on the month o
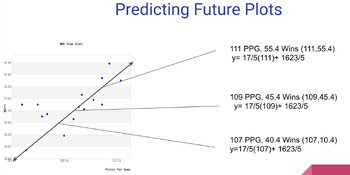
Scatter Plot Project on Desmos with Template
Learners will work to collect their own data from something they are interested in. They will then create a scatter plot using Desmos.com and analyze the information they collected. The analysis includes drawing their own trend line, finding the equation of that trend line, and predicting 3 values outside their original data collection. There are detailed directions with screenshots included along with a Google Slides template that can be shared with learners to help them organize their work. I
Subjects:
Grades:
7th - 9th
Types:
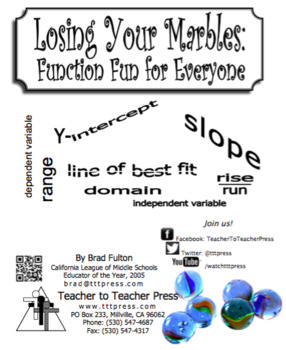
Losing Your Marbles: Function Connections You Can See
This visual demonstration/lab helps students make complete sense of functions. Topics addressed include slope, y-intercept, rise & run, slope-intercept form, domain & range, independent & dependent variables, and line of best fit. Whole number, fractional, and positive and negative slopes are addressed.
Adaptations make the lesson accessible to both younger and more advanced students.
The download includes complete instructions, activity masters, answer keys, Common Core alignment, a
Subjects:
Grades:
6th - 9th
Types:
Showing 1-24 of 97 results


