Function Fun, Unit 1: Patterns, T-tables, and Graphs
Teacher to Teacher Press
482 Followers
Teacher to Teacher Press
482 Followers
What educators are saying
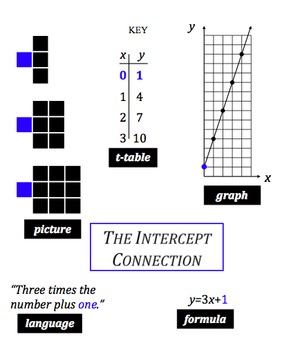
This is an absolutely awesome unit for teach the relationship between an equation, graph and t-table. Students see the connections between slope and y intercept very easily.
Description
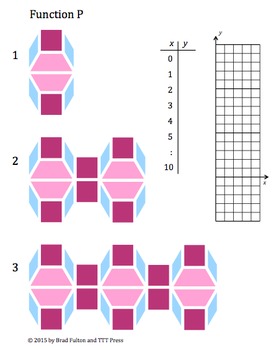
OVER 50 PAGES! These are the best strategies for teaching linear functions to all students. Tested in grades 4 through high school, this unit helps students develop competency with both the concepts and computations involved in functions. The multi-representational activities cover slope, y-intercept, t-tables, graphs, formulas, and visual representations of linear functions.
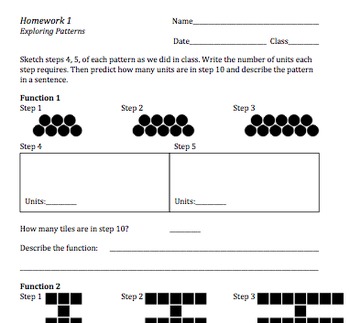
This unit is part 1 of a four-part series and includes 17 patterns in both color and black and white versions to provide the teacher with flexibility in classroom instruction and copy masters for homework. Detailed instructions, answer keys, and tips are included in the comprehensive unit.
Total Pages
55 pages
Answer Key
Included
Teaching Duration
3 days
Report this resource to TPT
Reported resources will be reviewed by our team. Report this resource to let us know if this resource violates TPT’s content guidelines.
Standards
to see state-specific standards (only available in the US).
CCSS5.G.A.1
Use a pair of perpendicular number lines, called axes, to define a coordinate system, with the intersection of the lines (the origin) arranged to coincide with the 0 on each line and a given point in the plane located by using an ordered pair of numbers, called its coordinates. Understand that the first number indicates how far to travel from the origin in the direction of one axis, and the second number indicates how far to travel in the direction of the second axis, with the convention that the names of the two axes and the coordinates correspond (e.g., 𝘹-axis and 𝘹-coordinate, 𝘺-axis and 𝘺-coordinate).
CCSS5.G.A.2
Represent real world and mathematical problems by graphing points in the first quadrant of the coordinate plane, and interpret coordinate values of points in the context of the situation.
CCSS6.EE.C.9
Use variables to represent two quantities in a real-world problem that change in relationship to one another; write an equation to express one quantity, thought of as the dependent variable, in terms of the other quantity, thought of as the independent variable. Analyze the relationship between the dependent and independent variables using graphs and tables, and relate these to the equation. For example, in a problem involving motion at constant speed, list and graph ordered pairs of distances and times, and write the equation 𝘥 = 65𝘵 to represent the relationship between distance and time.
CCSS7.EE.B.4
Use variables to represent quantities in a real-world or mathematical problem, and construct simple equations and inequalities to solve problems by reasoning about the quantities.
CCSS7.EE.B.4a
Solve word problems leading to equations of the form 𝘱𝘹 + 𝘲 = 𝘳 and 𝘱(𝘹 + 𝘲) = 𝘳, where 𝘱, 𝘲, and 𝘳 are specific rational numbers. Solve equations of these forms fluently. Compare an algebraic solution to an arithmetic solution, identifying the sequence of the operations used in each approach. For example, the perimeter of a rectangle is 54 cm. Its length is 6 cm. What is its width?


