134 results
7th grade graphing classroom forms for GATE

Valentine's Day Heart Candy Stacking STEM Challenge
Valentine Day Heart Candy Stacking STEM Challenge❤️ will get your students collecting data, averaging, analyzing data, and graphing during the holiday. ⭐This activity can also be used for STEAM Activities, STEM After School Programs, Summer Programs, Clubs, Maker Spaces, or at home. ⭐This product is included in my STEM BUNDLE #2 Challenge! ⭐Other Products you might like:➩STEM Challenges For the Whole Year Bundle➩Back to School STEM Challenge➪STEM Waterbottle Challenges➩STEM Valentines Day Chal
Subjects:
Grades:
3rd - 7th
Types:
Also included in: STEM Challenges Entire Year includes End of the Year STEM Activities
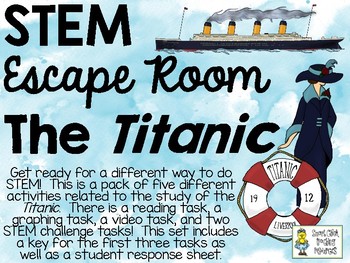
STEM Escape Room - The RMS Titanic
This STEM Escape Room Challenge is a set of five tasks for students to complete. There are a lot of different ways you can complete these five tasks. We do all five tasks over the course of a Friday afternoon in our classroom, or over a span of about 2 hours. You could also do these over the course of 2-3 class periods and students can pick up where they leave off each day. Student teams work at their own pace, they must complete the tasks in order and complete each task before they can move
Subjects:
Grades:
3rd - 7th
Types:
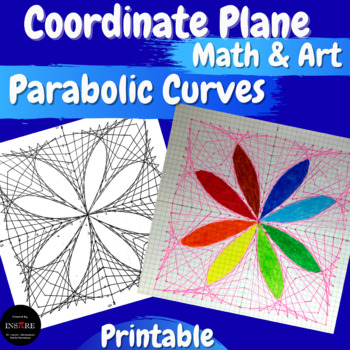
Coordinate Plane Graphing Parabolic Curves Math & Art 4 Quadrants String Art
Geometry Math Project - Practice ordered pairs plotting by using this fun activity. Make beautiful parabolic curves by drawing a series of straight lines.It's a great activity for the First Days of School, Back to School, Summer Camp, Summer School, or End of the Year.Can we draw a beautiful picture using only straight lines? Yes, we can. Check out this math & art project.Why do students love mystery picture graphing? They love discovering the next parts of the picture and guessing what it w
Subjects:
Grades:
6th - 9th
Types:
Football Stats Math Project - Upper Elementary Math: Graphing and Analyzing Data
This Football Stats Project incorporates the use of line plots, stem and leaf plots, analyzing upward and downward trends in data and median, mode, range and outliers. I also incorporated discussion and higher order thinking skills. Students will apply these concepts and skills to football statistics that they will research - included are suggestions for websites to research and topics to research.This would be best for 4th, 5th or 6th grade math students.This resource includes slides that intro
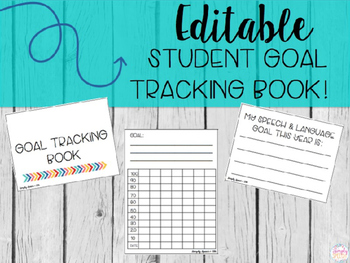
Editable Student Goal Tracking Book
These mini goal books are the perfect way to help your students keep track of their own goals. These books help increase student motivation and self awareness as they create their own personal goals and track their own progress.Here's what's included:Page 3: cover page options. This page is editable. Click on 'add text box' to add your students' names to their books.Page 4: Goal tracking sheets. Print as many of these pages as you need. This is also editable if you wish to type the goals in. Pag
Subjects:
Grades:
1st - 12th
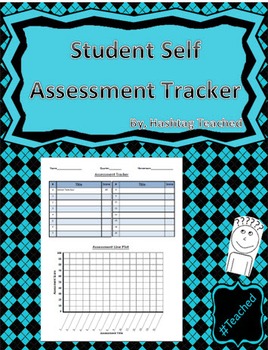
Student Assessment Tracker Template
Aligned with programs like Leader in Me where students take ownership over their own learning as well as the researched supported by John Hatties, there is an increase in achievement when students understand where they are in the learning process. This awesome tracker allows students to track their own assessment results in a table and then plot it onto a line plot. Students will improve in proficiency with data analysis, graphing as well as take ownership over their growth!
Students can use th
Grades:
2nd - 12th

Statistics Survey Project - Project Based Learning (PBL) with Math
Watch your students dive into the world of math as they create, execute, and analyze their own survey! Students will demonstrate mastery of data gathering, survey sampling, developing appropriate survey questions, data tables, Direct Variation, discrete graphs, dot plots, box and whisker graphs, and calculating the inter-quartile range.The Unique Survey Project is highly engaging, capitalizing on the innate curiosity of the adolescent mind. You will love the low-prep instructional guide. Your st
Subjects:
Grades:
6th - 10th
Types:
Also included in: Fun with Ratios Activities Bundle - 7th Grade PBL with Math
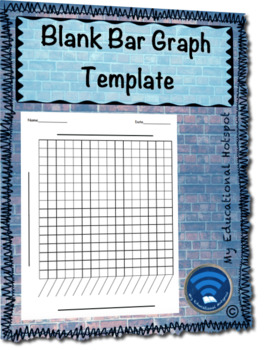
Blank Bar Graph Template
Check out this simple and organized template that has a labelled and specific sections for a bar graph. This outline is ideal for supporting students' understanding of graphing, for use with differentiation, or for modification for struggling students. Also, when used in science or social studies, when the lesson isn't on graphing, this can cut out a lot of wasted time. Presented in a simple and student-friendly way, the possibilities for implementation are endless!
Grades:
2nd - 10th
Function Fun, Unit 1: Patterns, T-tables, and Graphs
OVER 50 PAGES! These are the best strategies for teaching linear functions to all students. Tested in grades 4 through high school, this unit helps students develop competency with both the concepts and computations involved in functions. The multi-representational activities cover slope, y-intercept, t-tables, graphs, formulas, and visual representations of linear functions.This unit is part 1 of a four-part series and includes 17 patterns in both color and black and white versions to provide t
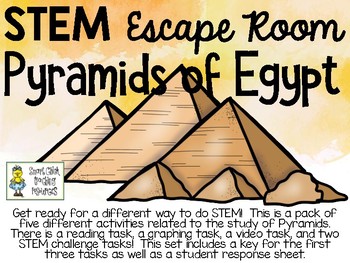
STEM Escape Room - PYRAMIDS of EGYPT
This STEM Escape Room Challenge is a set of five tasks for students to complete. There are a lot of different ways you can complete these five tasks. We do all five tasks over the course of a Friday afternoon in our classroom, or over a span of about 2 hours. You could also do these over the course of 2-3 class periods and students can pick up where they leave off each day. Student teams work at their own pace, they must complete the tasks in order and complete each task before they can move
Subjects:
Grades:
3rd - 7th
Types:
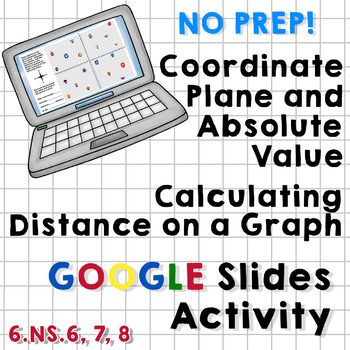
Coordinate Plane/Absolute Value/Distance on a Graph Google Slides Activity
This Google Slides Activity includes 14 slides containing basic reminders about the setup and use of a coordinate plane, calculating distance on a graph using absolute value, and describing directions as they relate to crossing over the axes.Students are asked to find the coordinates of several locations in "Grid Town" and then to describe the number of "city blocks" needed to travel to get from one destination to another. They are asked to use directional words (north/south/east/west) and dete
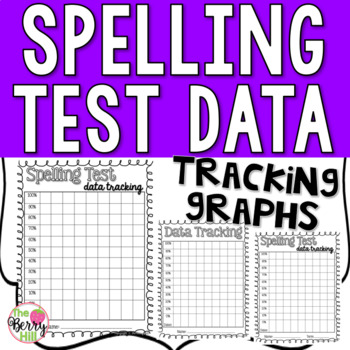
Spelling Test Data - Student Friendly Graphing
Perfect for allowing students to track their own data! Use this handout in a folder or notebook to let students see their progress in spelling throughout the school year.
*****************************************************************************
Customer Tips:
How to get TPT credit to use on future purchases:
• Please go to your My Purchases page (you may need to login). Beside each purchase you'll see a Provide Feedback button. Simply click it and you will be taken to a page where
Subjects:
Grades:
1st - 8th

Easy Chemistry - atoms, elements, and molecules
This is a beginners unit that introduces elementary students to chemistry basics. It covers atoms, elements, molecules, the periodic table, and Mendeleev. This unit uses backwards learning in that the students do the fun activities and then use critical thinking skills to relate their learning back to chemistry fundamentals. I used this unit with my fourth and fifth grade Gifted and Talented students and they loved it. Their learning was much deeper due to the activities which include block
Subjects:
Grades:
5th - 7th
Types:
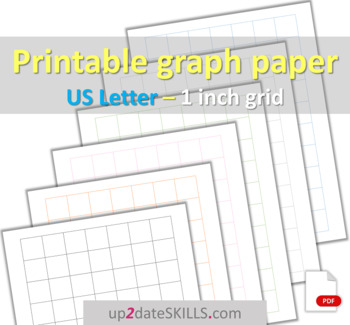
1 inch grid graph paper 7x10 squares per page Letter-size or Happy Planner Big
INFORMATION ON PRODUCT:12 PDF files: 6 files designed for 2-side printing + 6 files designed for 1-side printing and/or digital plannersPage size: Letter-size (inches: 8.5” x 11″ = centimeters: 21,59 cm x 27,94 cm)Grid size: 1 inchGrid color: grid in 6 different colors (black, blue, orange, gray, green, pink)Number of squares per page: 7x10 OTHER OPTIONS FOR PRINTABLE GRAPH PAPER:Check all the options you can find in my TpT store for printable graph paper below. You can get more information on p
Subjects:
Grades:
PreK - 12th, Higher Education, Adult Education, Staff
Types:
Also included in: BUNDLE: Graph Paper Letter-size or Happy Planner Big
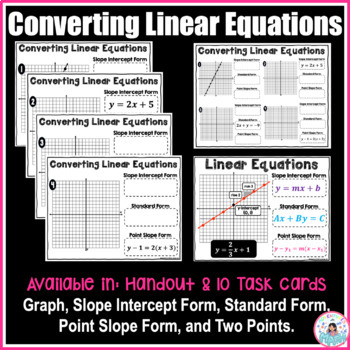
Converting Linear Equations: Slope Intercept, Standard, Point Slope, Two Points
The activity has 10 linear equations task cards. Students are only given one form in each problem (graph, slope-intercept form, standard form, point-slope form, or two points), and they are expected to determine the other forms.One version is the full-size page (one problem on one page). This can be done as task cards seated as partner work, or in small group centers.The other version is a handout, meaning there are four problems on one page. This would be great as a homework assignment after l
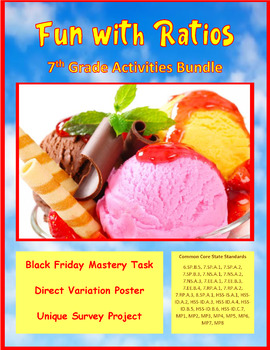
Fun with Ratios Activities Bundle - 7th Grade PBL with Math
The purpose of the Fun with Ratios Activities Bundle is to give students the opportunity to use creativity to apply ratios, proportions, and percentages in real-world settings. This bundle includes three unique tasks: Black Friday Mastery Task, Direct Variation Poster Mastery Task, and the Unique Survey Project. These activities and their accompanying materials are suited for students in grades 7 through 9. These lessons make excellent sub plans. Each project takes approximately two 60-minute bl
Subjects:
Grades:
7th - 9th
Types:
Student Accountability / Data File
These folders will allow your students to keep track of their assessments/test scores, understand their levels and abilities, and practice how to graph and record data at the same time! These Student Accountability Files will accomplish this objective and do so in a fun way!
Whether we like it or not, assessments and standardized tests are becoming more and more critical for students, teachers, and schools. Our students will have the most success possible by knowing how they are performing an
Grades:
1st - 8th

Coloring Pages for Adults Boho Landscape
About Boho Landscape Coloring Pages for Adults Graphic&&&&&&&&&&&&&&&&&&&&&&&&&&&&&&&&&&&&– WHAT YOU WILL GET?•184 INTERIOR PNG(300 DPI,1920*2528 px)•30 COVER PAGE (300 DPI,1920*2528 px)&&&&&&&&&&&&&&&&&&&&&&&&&&&&&&&&&&
Subjects:
Grades:
PreK - 12th, Higher Education, Adult Education
STEM Escape Room - TOWERS
This STEM Escape Room Challenge is a set of five tasks for students to complete. There are a lot of different ways you can complete these five tasks. We do all five tasks over the course of a Friday afternoon in our classroom, or over a span of about 2 hours. You could also do these over the course of 2-3 class periods and students can pick up where they leave off each day. Student teams work at their own pace, they must complete the tasks in order and complete each task before they can move
Subjects:
Grades:
3rd - 7th
Types:
QUIZ TRACKER - Teacher & Student EASY GRAPH: Data Wall, IEP, Student Reflection
Connect the Dots to see progress trends in spelling, math, reading, P.E. and more. If your students can connect the dots then your students can track data for you! Simply mark quiz / test results and connect the dots for a beautiful, easy to read progress graph and data sheet. Fantastic for a Data Wall, charting progress, monitoring improvement, and creating Data Driven education. Post one graph per student to create an INTERACTIVE DATA WALL where students mark their progress 'on the wall' after
Grades:
PreK - 12th, Adult Education
Types:
Milk Carton Apartments
An inexpensive and easily implemented hands-on lesson helps students understand functions and function notation. Concepts include slope, y-intercept, t-tables, graphs, direct and indirect variation, and the identity function. Common Core alignment is included along with complete instructions, activity masters, answer keys, and research tips. You'll even get an "udderly' silly trivia quiz about milk to amuse your students.
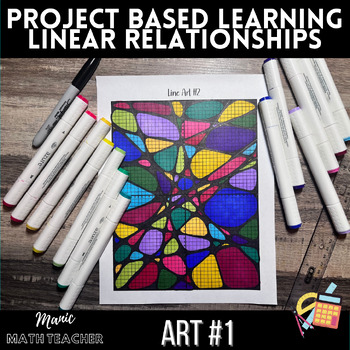
Linear Relationships Art #1 - Graphing Straight Lines - Project Based Learning
Linear Relationships Art #1 - Graphing Straight Lines - PBL, Project Based LearningThis math art project embodies the principles of project-based learning, merging mathematics with artistic expression to engage students in a multifaceted educational experience. Students will graph 18 linear equations, meticulously tracing each line then creating intricate oblong shapes within spaces created by the lines. The project culminates in a vibrant display of color as students fill in each unique shape,
Subjects:
Grades:
7th - 11th
Types:
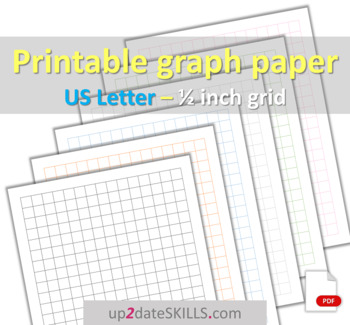
1/2 inch graph paper 15x20 squares per page Letter-size or Happy Planner Big
INFORMATION ON PRODUCT:12 PDF files: 6 files designed for 2-side printing + 6 files designed for 1-side printing and/or digital plannersPage size: Letter-size (inches: 8.5” x 11″ = centimeters: 21,59 cm x 27,94 cm)Grid size: 1/2 inchGrid color: grid in 6 different colors (black, blue, orange, gray, green, pink)Number of squares per page: 15 x 20 OTHER OPTIONS FOR PRINTABLE GRAPH PAPER:Check all the options you can find in my TpT store for printable graph paper below. You can get more information
Subjects:
Grades:
PreK - 12th, Higher Education, Adult Education, Staff
Also included in: BUNDLE: Graph Paper Letter-size or Happy Planner Big
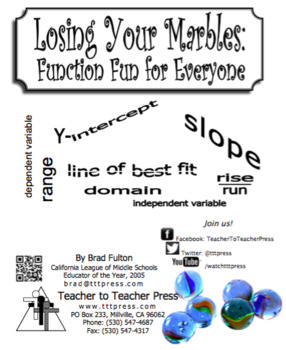
Losing Your Marbles: Function Connections You Can See
This visual demonstration/lab helps students make complete sense of functions. Topics addressed include slope, y-intercept, rise & run, slope-intercept form, domain & range, independent & dependent variables, and line of best fit. Whole number, fractional, and positive and negative slopes are addressed.
Adaptations make the lesson accessible to both younger and more advanced students.
The download includes complete instructions, activity masters, answer keys, Common Core alignment, a
Subjects:
Grades:
6th - 9th
Types:
Showing 1-24 of 134 results


