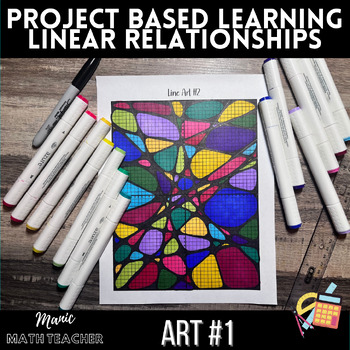
Linear Relationships Art #1 - Graphing Straight Lines - Project Based Learning
- PDF
Description
Linear Relationships Art #1 - Graphing Straight Lines - PBL, Project Based Learning
This math art project embodies the principles of project-based learning, merging mathematics with artistic expression to engage students in a multifaceted educational experience. Students will graph 18 linear equations, meticulously tracing each line then creating intricate oblong shapes within spaces created by the lines.
The project culminates in a vibrant display of color as students fill in each unique shape, applying their understanding of mathematical concepts through a creative lens. This approach not only reinforces skills in graphing and geometry but also encourages artistic creativity and attention to detail. Ideal for fostering a deeper appreciation for the intersection of math and art, this project makes learning both interactive and visually compelling.
2 Versions Included
This math art project comes in two versions:
- Equations are provided - this allows students to begin graph pre-determined equations, all projects will have the same outline. This will still allow for student artistic expression within their shape creation and color choices.
- The second version is where students craft their own, adhering to specific criteria. The latter challenges gifted and talented learners, promoting higher-order thinking as they develop equations. This self-generated approach deepens understanding, fostering analytical skills and creative problem-solving in a mathematically artistic context.
Looking for more math and art? Try one of these!
Line Art: created by plotting specific points and connecting them with straight lines to create an illusion.
Line Art #1 - Coordinate Plane - Plotting Points
Line Art #1 - Coordinate Plane - Rotations Points - Transformations: Rotations
Line Art #1 - Coordinate Plane - Reflecting Points - Transformations: Reflection
Scale Factor Projects: Given an image, students must enlarge using the grid method. This skill can then be translated to images of their choice and larger projects.
Scale Factor Drawing - Grid Method - Dilating/Enlarging with a Grid - Lesson
Scale Factor Drawing - Grid Method - Dilating/Enlarging with a Grid - Set #1
If these types of activities are something you enjoy, please consider subscribing to my bi-weekly mailing list for 5 FREE Order of Operations Color By Number activities.
**Be sure to confirm your subscription after submitting the form, you may want to check your spam folder if you do not immediately receive the confirmation in your email**
Resource List
This resource is a part of my 7th grade skills based curriculum that I am building, this is a work in progress and I will be focusing on 7th grade TEKS this year with hopes to expand to 6th and 8th grade. While I am based in Texas and most of the resources will be aligned with the TEKS, everything I am creating is skill based meaning they are not specific to Texas and can be used by anyone! Take a look through the Resource List linked below to see all that is available, it is a live document and will be updated as I go.
Terms of Use:
By purchasing this resource, you are agreeing that the contents are the property of Manic Math Teacher and licensed to you only for classroom/personal use as a single user. I retain the copyright, and reserve all rights to this product. Please remember to leave feedback so you will earn TpT Credits, which may be applied to your future purchase. If you like this resource and are interested in other similar products, please follow me on TpT.


