157 results
7th grade graphing research by TpT sellers for TpT sellers
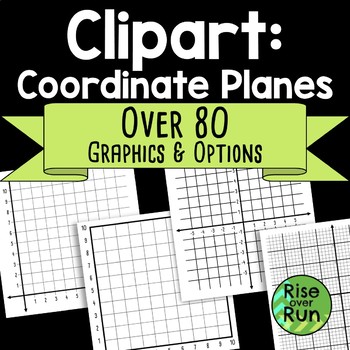
Coordinate Planes Graphs Clipart
Graphing clip art for math teachers and all kinds of math applications! Images include 1st quadrant graphs, all 4 quadrant graphs, 2 quadrant graphs, graphs with and without numbers, graphs with and without x and y axis labels. High quality jpg and png files are included. JPGs have white backgrounds, and PNGs have transparent backgrounds. All images are over 1000 pixels in each dimension. (They can be printed very large and will hold quality.) These are great for creating your own graphing acti
Subjects:
Grades:
5th - 12th
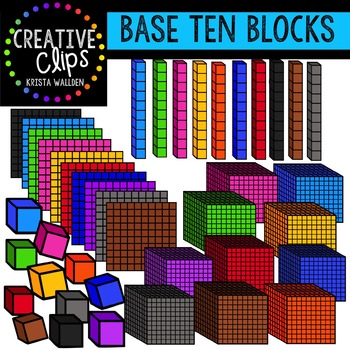
Base Ten Blocks {Creative Clips Digital Clipart}
This HUGE 88-image set is a must-have for creating your math resources! Included are 81 vibrant, colored images and 7 black and white versions. These base ten blocks come in all 12 of my signature Creative Clips colors and are perfect for incorporating into any seasonal math resource with so many color choices!
This set includes 2D versions of ones, tens, and hundreds in 12 different colors, as well as 3D versions of ones, tens, hundreds and thousands blocks in 12 colors.
The images will have
Subjects:
Grades:
PreK - 12th, Staff
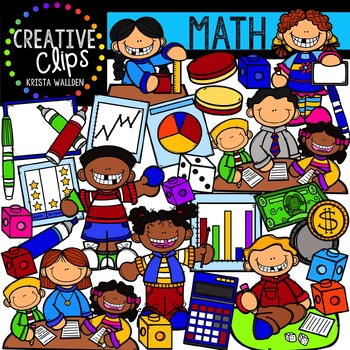
Math {Creative Clips Digital Clipart}
This HUGE 74-image set is a must-have for creating your math resources! Included are 52 vibrant, colored images and 22 black and white versions.
Looking for other school subject clipart? Check out my bundle of sets for math, science, social studies, reading and writing at a discount!
SCHOOL SUBJECT BUNDLE
The images will have high resolution, so you can enlarge them and they will still be crisp.
All images are in png formats so they can easily be layered in your projects and lesson material
Subjects:
Grades:
PreK - 12th, Staff

Algebra Marketing Plan PBL | project based learning | real world Math
This Project Based Learning activity will help Algebra 1 students practice setting up and solving systems of linear equations within a real world context. As they take on the role of an entrepreneur, they will write equations, plot coordinate points, graph equations, analyze data, and draw conclusions. This can be used as a group project or individual project and would work great for an end of unit review. ------------------------------------------------------------------------------------------
Subjects:
Grades:
7th - 12th
CCSS:
Also included in: Math Algebra 1 BUNDLE projects, activities, notes, and more
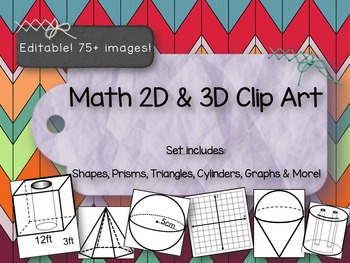
Clip Art Shapes -2D & 3D Prisms, Graphs, Cylinders and more! PPT File
One of the teachers at my school was having trouble finding some 3D geometric shapes to make her test with, so I made a few for her. Then one thing led to another, and now I have a whole bunch of clip art that I thought a Math teacher might find useful. I have used these images to create tests, task cards, scavenger hunts, and practice work for Math small group and centers.
This file is not meant to be used as a presentation. The idea is that you can copy/paste whatever you need from here a
Subjects:
Grades:
5th - 10th
Create a Survey - Research Skills
Scaffolded printables to guide every step of the survey process! Can be used for ANY survey design. Designing a survey is an exciting way for students to conduct research and discover information about a group of people. Throughout the survey process, students have an opportunity to be creative, engage in problem solving and develop critical skills in analytical thinking. A powerful data-gathering tool, surveys are a thought-provoking and dynamic method of research that students love to engage
Subjects:
Grades:
5th - 8th
Types:
Iditarod Student Packet - Daily Tracking (Data Collection, Map Skills, Research)
Iditarod Student Packet - Daily Tracking (Data Collection, Map Skills, Research)This is the page for the previous OLDER version. If you purchase this product you are buying an older version.Click on the link below to be directed to the NEWER, UPDATED, EDITABLE version of this product:https://www.teacherspayteachers.com/Product/Iditarod-Student-PktDaily-Tracking-UPDATE-Data-CollectionMap-SkillsResearch-9140503This is a great resource for students who are interested in learning more about The Last
Subjects:
Grades:
3rd - 7th
Types:
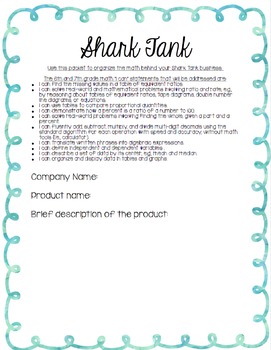
Shark Tank Project
Based on the hit show Shark Tank, students will create a product and business plan to pitch to the "Sharks". This product comes complete with the student packet, certificate for students, questions/script for the sharks, and teacher hints for how to make this a hit!All tasks within the project are connected to 6th and 7th grade CCSS math standards. "I Can" statements are provided in the student packet.Students will:-Create a company name and product-Determine the cost per product to make-Determi
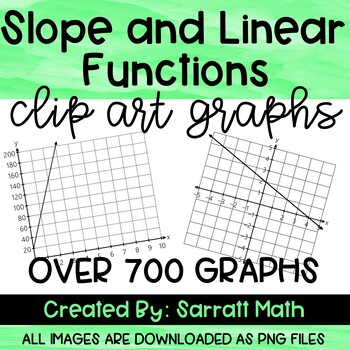
Slope and Linear Functions Clip Art Graphs - Math Clip Art
Looking for algebra 1 clip art images to make resources for your classroom? This linear function clip art graph set contains over 700 png files that include:Graphs with positive and negative slopesGraphs with zero and undefined slopes (horizontal and vertical lines)2 Blank graphs (5x5 and 10x10)Various graph sizes: 5x5 grid and 10x10 grid (x and y both increase by 1 unit)x increase by 1 and y increase by 2x increase by 1 and y increase by 3x increases by 2 and y increases by 2x increases by 1 an
Subjects:
Grades:
7th - 12th, Higher Education
1/2 Inch by 1/2 Inch Grid Paper (FREE)
This resource is great for use in teaching many GT activities where a grid is needed for scaling or teaching area in modeling or independent student work. It may also be used for Cartesian Coordinate Graphing in middle school. We always laminate these resources, so we can use them over and over and with vis-à-vis markers during direct teach.
Subjects:
Grades:
2nd - 8th
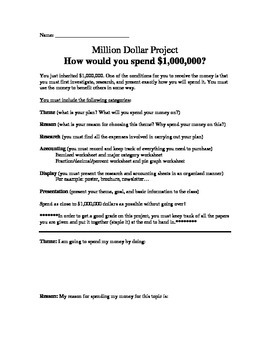
Million Dollar Project (Graphing, decimals, fractions, accounting and percents)
What would you do with a million dollars? How would you spend it?
In this project you've been left a 1 million dollar inheritance. The catch is you must first research and present how you will spend the money.
In the first part of the experiment, the students will fill out an accounting chart, where they will fill out an itemized chart displaying each item they plan on purchasing to complete their million dollar project. They will than be asked to put all those items into major categorie

Scatter Plot and Bivariate Data Research Project
Students will begin a statistics project on one of their favorite restaurants or food chains! They will be researching nutrition facts and surveying others on what types of food they like to eat there. Through this data collection they will work on their skills of creating scatter plot graphs, creating relative frequency tables, and analyzing this data. This can be used either by paper or digitally. I used it the last two years during distance learning. Rubric included.
Subjects:
Grades:
7th - 12th
Types:
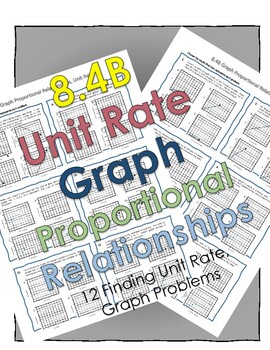
8.4B Unit Rate, Graph Proportional Relationships (Mirrored Questions)
8.4B Unit Rate, Graph Proportional RelationshipsThis includes 12 Graph Problems that students are able to easily understand.Get students to learn how to identify the unit rate of a graph that models the relationship. Graph problems vary in degree of difficulty and allows students to understand mirrored questions from state assessments.Also includes:- Ratio problems- Graphs- AnswersCan also be used as worksheet for classwork, homework, quizzes or test preparation.Easy to understand and Easy to g
Subjects:
Grades:
7th - 9th
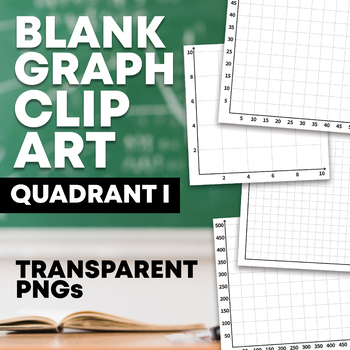
Graphing Clip Art: Quadrant I Blank Graphs
Stop searching online for mismatched blank graphs for your worksheets! This set of 36 transparent PNGs are perfect for teachers or TPT sellers looking to make cohesive, customized worksheets, flash cards, or other educational products using Quadrant I of the coordinate plane. Graphs include:5x5 grid, from 0-5 to 0-500 and blank10x10 grid, from 0-10 to 0-500 and blank16x16 grid, from 0-16 to 0-1600 and blankClick "View Preview" to view the Terms of Use and a preview of the product before purchasi
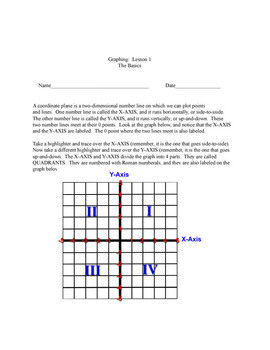
Graphing Booklet #1: The Basics of the Coordinate Plane
I created this booklet for use in my classroom. I have also used it to help students I tutor. I teach geometry, and I noticed that I had a few students who still could not plot points correctly. I made this booklet, which includes step-by-step lessons and activities on the basics of the coordinate plane (the x and y-axis, the origin, the quadrants, ordered pairs, plotting points), and it has helped the students tremendously. When I shared this booklet with other teachers, they requested copi
Grades:
4th - 9th
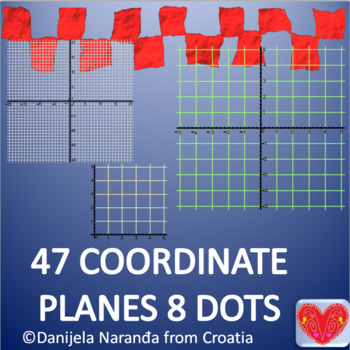
Coordinate Planes Graphs, Grids, Clip Art, Template
56 png images, high quality, on transparent background47 images of coordinate planes with grids (templates) I,II, III and IV quadrant 20x20 by 1, 10 x10 by 1, 10 x 10 by 0.5, 20 x 20 by 5, 5x5 by 0.25I quadrant 5x5 by 1, 5x5 by 0.5, 10x10 by 18 dots for coordinate planes, different color
Subjects:
Grades:
5th - 12th, Higher Education
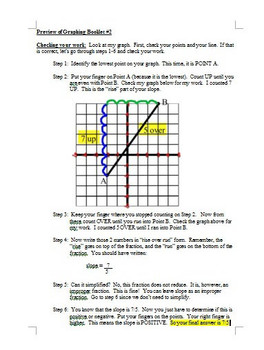
Graphing Booklet #2: Slope Formula and the Rise over Run Method
This is my follow-up to my first graphing booklet. In this booklet, students will first determine whether the slope of a line is positive, negative, zero, or undefined by looking at a graphed line. This lesson is crucial in future success of determing the exact slope of a line. In lesson 2, students will learn the "rise over run" method of determining slope of a graphed line. I teach this differently than many people, and I explain a very simple (tactile) method of determing whether a slope
Grades:
5th - 10th

Coloring Pages for Adults Boho Landscape
About Boho Landscape Coloring Pages for Adults Graphic&&&&&&&&&&&&&&&&&&&&&&&&&&&&&&&&&&&&– WHAT YOU WILL GET?•184 INTERIOR PNG(300 DPI,1920*2528 px)•30 COVER PAGE (300 DPI,1920*2528 px)&&&&&&&&&&&&&&&&&&&&&&&&&&&&&&&&&&
Subjects:
Grades:
PreK - 12th, Higher Education, Adult Education
Weather Tracking in Excel
Compatible with Google Sheets, Google Classroom, or as a stand-alone file on a PC, this product is a must have for any teacher comparing weather conditions in multiple locations!
BEFORE YOU BUY: This file is part of a larger unit. Save yourself money by purchasing the Super Science Set for Weather and Climate nstead of buying each file separately.
Purchased alone, you get:
⭐ An Excel workbook that enables students to track the weather for 5 different locations as a whole class or individ
Subjects:
Grades:
4th - 8th
Types:

Hurricane Project
This is a great project for students to understand hurricanes to the full extent. We would study hurricanes over a few weeks showing students videos, data, going to the National Hurricane Center website, giving them the opportunity to learn how to plot coordinates and track them. They will understand the damage that can be done and who is called in after a hurricane has hit and the help the city will receive. They will create a hurricane from start to finish, choosing a name based on the month o
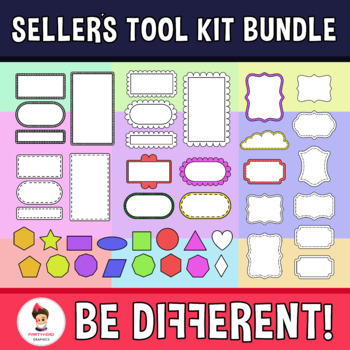
Seller's Tool kit Bundle - Frames, Shapes, Backgrounds, M. Exerc....
Enjoy! This set includes the following images on 300dpi.Here are the details:- Frames.- Backgrounds.- Differents shapes.- Covers.- Excercise pages.- Different colors for all.- Blackline version.Email: adolfo-1985@hotmail.comEnjoy and be happy :).TERMS OF USE: This resource is for limited educational and commercial use. Please make sure the images are flattened and/or protected. You can use it to create your own products as long as there is educational content included. This product can be used t
Grades:
PreK - 12th, Higher Education, Adult Education, Staff
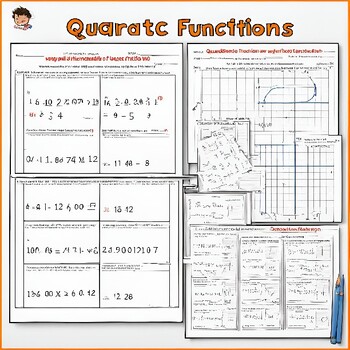
Quadratic Functions Worksheets Algebra 1
**Quadratic Functions Worksheets: Engaging and Comprehensive Practice for Students**Unlock the power of quadratic functions with our meticulously designed Quadratic Functions Worksheets, perfect for middle and high school math students. These worksheets provide a comprehensive and engaging way for students to master the core concepts and applications of quadratic functions, from basic to advanced levels.**What's Inside:**1. **Introduction to Quadratic Functions:** - Understanding the standard
Grades:
5th - 12th
Find the Error - Data and Graphs with Central Tendency and Variation
This is an activity that I created for my students to find the mistake when a student has answered questions from graphs about measures of center and variation incorrectly. I used common errors to help them see the mistakes commonly made. All of my products are common core aligned.I had the students work alone to solve the problems first, and then share with their groups. If there was any discrepancy, they looked in the answer folder on their tables to see the correct answer. I rotated around
Subjects:
Grades:
5th - 7th
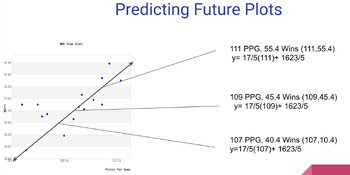
Scatter Plot Project on Desmos with Template
Learners will work to collect their own data from something they are interested in. They will then create a scatter plot using Desmos.com and analyze the information they collected. The analysis includes drawing their own trend line, finding the equation of that trend line, and predicting 3 values outside their original data collection. There are detailed directions with screenshots included along with a Google Slides template that can be shared with learners to help them organize their work. I
Subjects:
Grades:
7th - 9th
Types:
Showing 1-24 of 157 results


