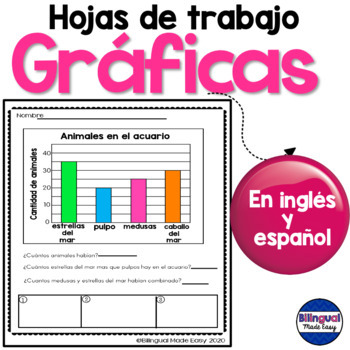
Hojas de trabajo de matemáticas: Graficas en inglés y español
Bilingual Made Easy
2.1k Followers
Grade Levels
2nd - 3rd
Subjects
Resource Type
Standards
CCSS2.MD.D.10
CCSS3.MD.B.3
Formats Included
- PDF
- Internet Activities
- Easel Activity
Pages
44 pages
Bilingual Made Easy
2.1k Followers
Easel Activity Included
This resource includes a ready-to-use interactive activity students can complete on any device. Easel by TPT is free to use! Learn more.
Compatible with Digital Devices
The Teacher-Author has indicated that this resource can be used for device-based learning.
Description
USE AS A DIGITAL PRODUCT OR PRINT THE PDF
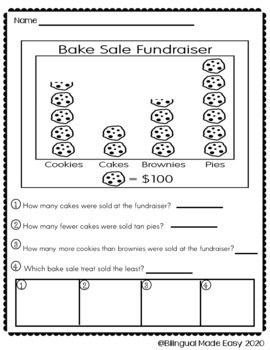
This Bilingual Graphing Unit (English/Spanish) for second and third graders includes 10 different types of graphing worksheets to master this mathematical skill. Graphs are also included in color for a teacher to model. Each graph worksheet was created in English and has an identical worksheet in Spanish. This unit was designed to be used with English Language Learners in a Bilingual, English as a Second Language or Dual Language classroom. You no longer need to translate your worksheets or break your students in groups! This unit will make teaching a whole group lesson where every child, regardless of their dominant language, can actively participate.
Total Pages
44 pages
Answer Key
Included
Teaching Duration
N/A
Report this resource to TPT
Reported resources will be reviewed by our team. Report this resource to let us know if this resource violates TPT’s content guidelines.
Standards
to see state-specific standards (only available in the US).
CCSS2.MD.D.10
Draw a picture graph and a bar graph (with single-unit scale) to represent a data set with up to four categories. Solve simple put-together, take-apart, and compare problems using information presented in a bar graph.
CCSS3.MD.B.3
Draw a scaled picture graph and a scaled bar graph to represent a data set with several categories. Solve one- and two-step “how many more” and “how many less” problems using information presented in scaled bar graphs. For example, draw a bar graph in which each square in the bar graph might represent 5 pets.


