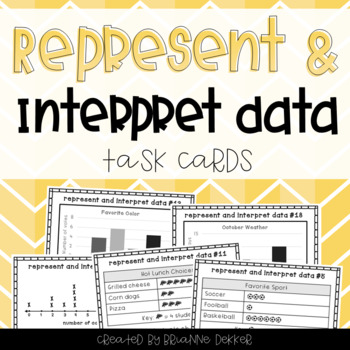
Represent and Interpret Data Task Cards
Brianne Dekker
980 Followers
Grade Levels
2nd - 4th, Homeschool
Subjects
Resource Type
Standards
CCSS3.MD.B.3
Formats Included
- PDF
- Easel Activity
Pages
9 pages
Brianne Dekker
980 Followers
Easel Activity Included
This resource includes a ready-to-use interactive activity students can complete on any device. Easel by TPT is free to use! Learn more.
What educators are saying
These task cards are great practice for my students at the end of the data unit. These are great to use in small groups.
This is one of the standards that often does not get discussed until later in the year. I've found using this resource at math stations to introduce it to students helps a lot for when students encounter it on progress monitoring assessments like STAR or MAPS.
Description
These 24 task cards target representing and interpreting data, aligned with the Grade 3 GoMath curriculum, Chapter 2. They include practice with reading and creating picture graphs and bar graphs as well as solving problems based on data, graphs, and line plots.
A recording sheet and answer key are included.
***
You might also be interested in:
- Represent and Interpret Data worksheets - $1
- Graphing the Weather Worksheets and Projects - $2
Would you like credit for future purchases?
Don't forget to leave feedback on this product for credits that can be used on future purchases! Visit your "My Purchases" page and click on the "Provide Feedback" button underneath this product listing. Then give this product a quick comment and rating. I value your feedback greatly and the credits you earn will give you discounts for the next time you shop on TPT, so it's a win for us both!
Follow me!
Be the first to know about my new products and freebies by following me! Look for the green star near my store logo and click it to become a follower.
You can also visit me on Pinterest here!
Total Pages
9 pages
Answer Key
Included
Teaching Duration
N/A
Report this resource to TPT
Reported resources will be reviewed by our team. Report this resource to let us know if this resource violates TPT’s content guidelines.
Standards
to see state-specific standards (only available in the US).
CCSS3.MD.B.3
Draw a scaled picture graph and a scaled bar graph to represent a data set with several categories. Solve one- and two-step “how many more” and “how many less” problems using information presented in scaled bar graphs. For example, draw a bar graph in which each square in the bar graph might represent 5 pets.


