7 results
Graphing Common Core 3.MD.B.3 resources for SMART Notebook

Grade 3 Math Module 6 Topic A
Topic A begins with a
lesson in which students generate categorical data, organize it, and then represent it in a variety of forms.
Drawing on Grade 2 knowledge, students might initially use tally marks, tables, or graphs with one-to-one
correspondence. By the end of the lesson, they show data in tape diagrams where units are equal groups
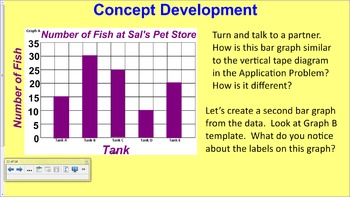
with a value greater than 1. In the next two lessons, students rotate the tape diagrams vertically so that the
tapes become the units or bars of scaled graphs
Subjects:
Grades:
3rd
Types:

Fall Math using the Smart Board
Fall Math is a set of eleven activities for 3rd grade common core. This could also be used as enrichment for grade 2 or review for students in grade 4. Each page has one of my original photos(mainly pumpkins and fall trees) from the New England area with multiple activities per page. Activities include telling time to the minute, measurement, multiplication, using bar graphs, fractions, and multiple step word problems. Each page has the answers given with an interactive device so students c
Subjects:
Grades:
2nd - 4th

Engage NY (Eureka) 3rd Grade Common Core Math Module 6-Topic A
If you love Engage NY, but are looking for a more engaging way to teach the modules, you have come to the right place! This notebook file for SmartBoard follows the 3rd grade Module 6-Topic A, Lessons 1 - 4. If you like these lessons, follow me for full topic notebooks for more topics, other modules and grade levels. Save time and energy while engaging students in common core math! These lessons cover generating and analyzing categorical data. Engage NY created the modules, I made them easi
Grades:
3rd
CCSS:

Data Analysis and Probability Smartboard Lesson.
The smartboard lesson reaches more learning syles with in the classroom. This smartboard lesson has 46 slides. This is comprehensive. Your students will learn how to read charts and graphs as well as how to problem solve. We hope it helps your students.
You can download a copy of the Data Analysis and Probability Journal too at our store, so your students can follow along more engaged using paper pencil. created by teams4education
credits to ode-ohioportal.
Subjects:
Grades:
3rd - 4th
Types:

NY State Module 6 Graphing
This file follows all prompts and procedures (including fluency activities) for the modules posted by NY state to meet the Common Core standards. It is the 6th 3rd grade unit which covers 9 days of graphing. You will want to go to the website for Engage NY to obtain the related worksheets and assessments.
Grades:
3rd

Graphs through Notebook
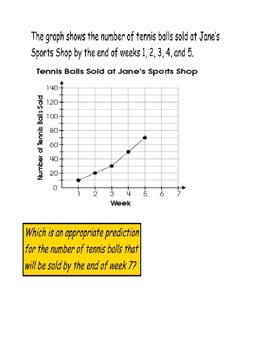
Get your students up and engaged with Interactive Graphs! This set includes pages for your students to practice skills related to: Bar Graphs, Line Graphs , Pictographs, Coordinate Graphs, and Venn Diagrams. Interactive for students on SmartBoard through Notebook. Line graph and coordinate graph have adjustable points to challenge students and allow for multiple uses.
Subjects:
Grades:
2nd - 6th
Types:

Eureka Math Module 6 Topic A
This is a Smartboard lesson for Eureka Math for Module 6, Topic A. The slides include problems sets, fluency practices, and concept development problems. We follow the Eureka Math pacing guide, therefore some lessons may be eliminated, but 90% are listed. I know our District enjoyed using these lessons and I hope you do too!
Subjects:
Grades:
3rd
Types:
Showing 1-7 of 7 results


