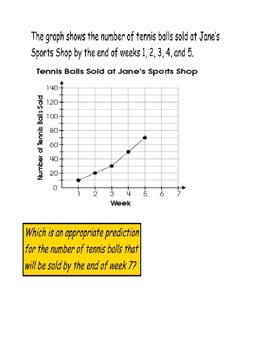
Data Analysis and Probability Smartboard Lesson.
Funkey Monkey
30 Followers
Grade Levels
3rd - 4th
Subjects
Resource Type
Standards
CCSS3.MD.B.3
CCSSRI.4.7
Formats Included
- NOTEBOOK (SMARTboard) File
Pages
46 pages
Funkey Monkey
30 Followers
Description
The smartboard lesson reaches more learning syles with in the classroom. This smartboard lesson has 46 slides. This is comprehensive. Your students will learn how to read charts and graphs as well as how to problem solve. We hope it helps your students.
You can download a copy of the Data Analysis and Probability Journal too at our store, so your students can follow along more engaged using paper pencil. created by teams4education
credits to ode-ohioportal.
You can download a copy of the Data Analysis and Probability Journal too at our store, so your students can follow along more engaged using paper pencil. created by teams4education
credits to ode-ohioportal.
Total Pages
46 pages
Answer Key
N/A
Teaching Duration
N/A
Report this resource to TPT
Reported resources will be reviewed by our team. Report this resource to let us know if this resource violates TPT’s content guidelines.
Standards
to see state-specific standards (only available in the US).
CCSS3.MD.B.3
Draw a scaled picture graph and a scaled bar graph to represent a data set with several categories. Solve one- and two-step “how many more” and “how many less” problems using information presented in scaled bar graphs. For example, draw a bar graph in which each square in the bar graph might represent 5 pets.
CCSSRI.4.7
Interpret information presented visually, orally, or quantitatively (e.g., in charts, graphs, diagrams, time lines, animations, or interactive elements on Web pages) and explain how the information contributes to an understanding of the text in which it appears.


