408 results
Free statistics worksheets
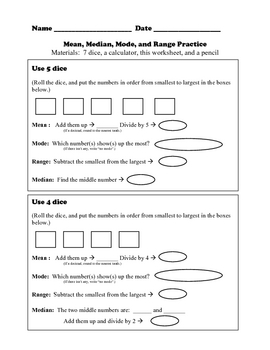
Mean, Median, Mode, and Range - Dice Practice Activity
This is a quick activity that I came up with for my seventh grade special needs students. It involves the students rolling different combinations of dice and finding the mean, median, mode and range for what they rolled. It is a very guided activity and provides prompts throughout. I did one example problem on the board, and all of my students were able to progress through the activity independently. If used with a larger group, a teacher would probably want to pair up the students so that t
Subjects:
Grades:
5th - 8th
Types:
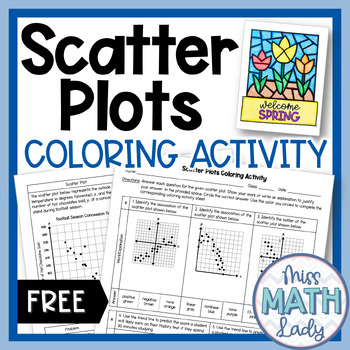
FREE Scatter Plots 8th Grade Math SPRING Coloring Activity
Are you looking for an engaging activity that provides students with the opportunity to practice their understanding of scatter plots? If your students are ready to review bivariate data such as patterns of association, outliers, making predictions, and creating trend lines, this printable Spring coloring activity is just what you need!This activity includes 10 multiple choice problems per worksheet. Each problem has three answer choices to choose from. This worksheet assesses the following conc
Subjects:
Grades:
8th
Types:
Also included in: 8th Grade Math Spring and Summer Color by Number Activity Bundle
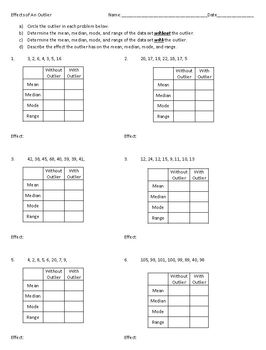
Effects of an Outlier on Mean, Median, Mode, and Range
This worksheet helps reinforce the effect of an outlier on the mean, median, mode, and range of a data set. Six data sets are provided. Students must calculate the mean, median, mode, and range of each data set with the outlier included, then with the outlier excluded. They must then determine what effect the outlier has on these statistics when included in the data set. A complete answer key is also provided.
Subjects:
Grades:
6th - 9th
Types:
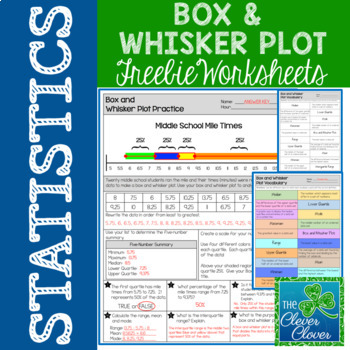
Box and Whisker Plot - FREEBIE
This resource can be used for practice with creating and interpreting box and whisker plots. Students will use twenty mile times in order to calculate the five number summary. Space is provided for students to list the numbers in order from least to greatest. Students are directed to shade and label each quartile of the box and whisker plot. After the plot has been drawn, students can answer six questions pertaining to the data.
Practice with vocabulary is also important. Students can use
Subjects:
Grades:
6th - 9th, Adult Education
Types:
Also included in: Statistics Bundle - Guided Notes, Worksheets & Scavenger Hunts!

FREE Water Bottle Flip Line Plot Activity
Have your student flip water bottles and see how many times they successfully flip it! Record data and create a line plot!
Check out my other line plot activity here!
Fidget Spinner Line Plot
Subjects:
Grades:
3rd - 8th
Types:
Also included in: Probability Activity BUNDLE
Skittles Line Plot Activity
Suggestions for this lesson:
-Use this as an assessment piece based on the work you have already done in working on understanding line plots in your classroom
-Use this as a reward activity that is still curriculum based.
-Use this as a review for the end of a unit.
-Use this as an introduction to line plots in your classroom as a “hook.”
Things you will need:
-A class set of print outs from this packet for your class
-An anchor chart to explain to students how to create a line plot (I suggest
Subjects:
Grades:
2nd - 4th
Types:
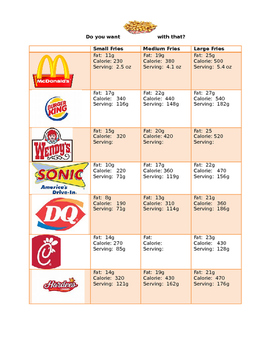
French Fry Scatter Plot & Best Line of Fit
Students will compare the nutritional values and serving sizes of french fries from various fast food restaurants. Based on this information, they will create scatter plots, best lines of fit and the equation of the trend line. Using the equation, they will estimate the unknown values of kid meals and supersized portions of french fries.
Subjects:
Grades:
8th - 11th
Types:
Probability Activity Worksheets and Problems Freebie
Probability is the topic of this worksheet and problems pack, and you'll cover the basics with this set of notes and problems. Students take notes on probability, outcomes, and events as well as standard outcomes expected with coins, dice, marbles, spinners, cards, and words. Then two pages of problems are presented for discussion and practice. This pack also includes a higher level thinking question for students to reflect on and answer as well. All answer keys are included in full color. S
Subjects:
Grades:
5th - 7th
Types:
CCSS:
Also included in: Probability Activity Bundle with Presentation TaskCards and Activity
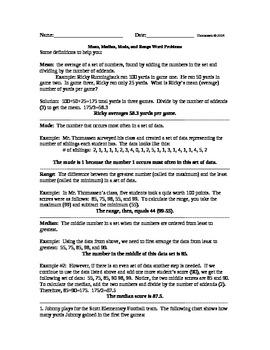
Mean Median Mode and Range Word Problems FREE
These free mean, median, mode, and range word problems (10 problems in a total of 20 pages with the definition overview and answer key) combine silly names and teacher-created data for the students to work with. Also, the beginning provides a quick definition overview of how to solve mean, median, mode, and range. This organizer provides a great amount of space for students to show their work. Don’t forget to peruse my other resources for Mean, Median, Mode, and Range. Thank you!
Subjects:
Grades:
5th
Types:
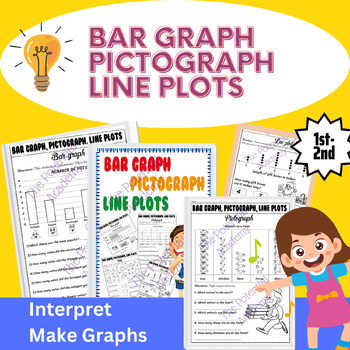
Bar Graphs, Pictographs, Line Plots, Tally Graph worksheet - Types of graph
Are you looking for a mix of no-prep activities for bar graphs, pictographs, and line plots? This Bar Graph, Pictograph, Tally, and Line Plots pack includes a variety of exercises for practicing reading graphs, showing data, and analyzing data on bar graphs, pictographs, and line plots in no time!The two main activities, reading graphs and drawing graphs, were designed with different practices to enhance their understanding of working with bar graphs, pictographs, tally, and line plots. There ar
Subjects:
Grades:
1st - 2nd
Types:
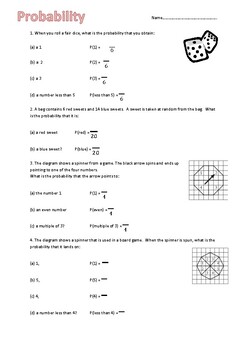
FREEBIE! - Scaffolded basic probability worksheet
This worksheet is perfect for low ability, SEN and struggling students to help support them in finding basic probabilities. The worksheet has fractions included and students have to fill in the missing spaces. A good supporting worksheet for an intro into probability. Answer key included.
Subjects:
Grades:
7th - 9th
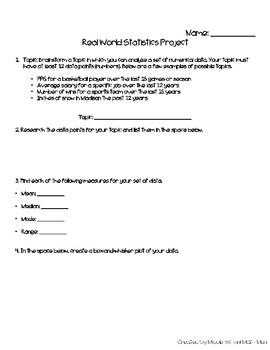
Box-and-Whisker Plot Real World Project (Middle School Math)
In this activity, students must research a set of numerical data and analyze it using measures of central tendency (mean, median, mode, range). Then will then create a box-and-whisker plot of their set of data.
For this activity, students will need access to the internet so that they can research a set of data of their choosing. All of my middle school math students enjoyed this project, but especially those that were interested in sports and could research the statistics of their favorite play
Subjects:
Grades:
6th - 8th
Types:
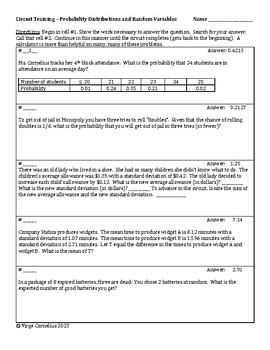
Circuit Training -- Probability Distributions and Random Variables
I wrote this set of 20 exercises to give my students more practice with the "bridge unit" (probability) between the basics of statistics and inference. A calculator is deifnitely required. Students begin in cell #1, work the problem, search for that answer and continue in this manner until the complete the circuit (get back to the beginning). This circuit is challenging! Let me know what you think! virge@virgecornelius.com
Subjects:
Grades:
10th - 12th, Higher Education
Types:
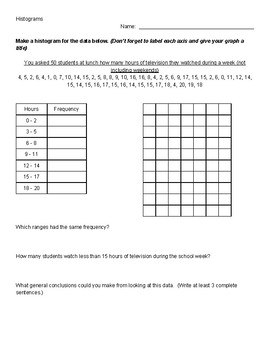
Histograms
Students will practice making histograms and manipulating bin width to see the change in frequency.
Subjects:
Grades:
6th - 9th
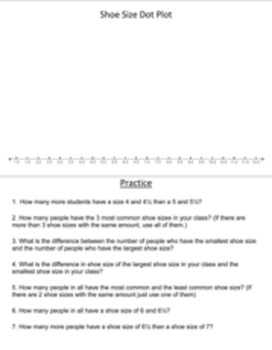
Shoe Size Dot Plot
Introduce Dot Plots by using this activity in your classroom. Collect the information with your class and fill in the dot plot. There are also high level comprehension questions to go along with the dot plot to assess your students knowledge. This would also go into an interactive journal or notebook. This activity covers the NEW 2014-2015 Math TEK 4.9(A) summarize a data set with multiple categories using a frequency table, dot plot, pictograph, or bar graph with scaled intervals.
Subjects:
Grades:
3rd - 6th
Types:
CCSS:
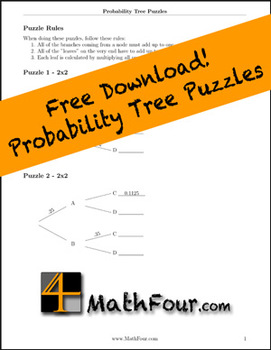
Probability Tree Puzzles
Using probability tree diagrams to teach probability is helpful - but sometimes kids need a little practice with them.
This worksheet has 11 probability tree diagrams to be "worked" as puzzles. This gives students practice filling them in and understanding the dynamics.
Once they have this practice, they can effectively use probability trees diagrams as tools.
Make sure you also download my Probability Trees Explained free "cheat sheet."
Subjects:
Grades:
8th - 12th, Higher Education
Types:
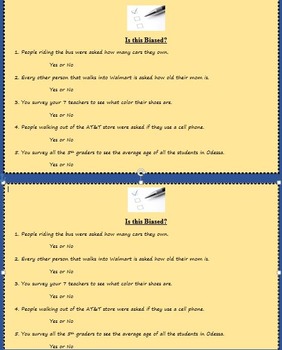
Is this Biased? (populations and random samples)
This is a 5 question quiz, exit ticket, do now, or homework assignment that reviews how surveys and samples can be biased sometimes. All 5 can be answered with a yes or no for whether it is indeed a biased survey. Enjoy and please rate and/or comment on this product!
Subjects:
Grades:
5th - 9th
Types:
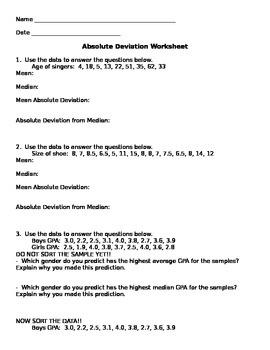
Mean Absolute Deviation Worksheet
Students will practice finding measures of central tendency and then calculate the mean absolute deviation as well as the absolute deviation from the median.
Subjects:
Grades:
6th - 10th
Types:
CCSS:
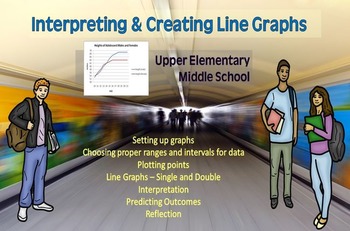
INTERPRETING AND CREATING LINE GRAPHS
Are you looking for a quick way to assess your students' mastery of double line graphs? Here it is! This can be used to practice creating double line graphs or to determine previous learning. It is ready to go! I would use it in all middle school grades maybe even lower if students are ready! This activity could also be changed to practice double bar graphs, if you want to extend the learning. It could also be used for substitute work in upper grades. It is a great way to teach creating graphs i
Subjects:
Grades:
5th - 8th
Types:
Statistics: Plots, Shapes of Distributions, Choosing Mean or Median
Statistics Integrated Review: Plots, Shapes of Distributions, and Statistics for Center and SpreadUse common data plots to determine shape of the data distribution, and choose appropriate statistics for center and spread. This product includes a one-page integrated review with a worksheet and answer key aligned with the common core. Students practice identifying the shape of a data distribution using common data plots (dot plot, histogram, and boxplot). Students also review how to choose appropr
Subjects:
Grades:
8th - 12th
Types:
CCSS:
Also included in: Bundle: Algebra 1 Statistics Unit Curriculum (Common Core)
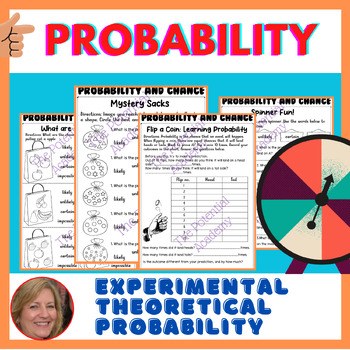
Chance and Probability, Theoretical & Experimental Probability Activities (FREE)
Do your children have trouble determining the likelihood of events and situations? Then this Probability and Chance package is for you! This set is packed with full worksheets and activities to teach your children all about Probability & Chance.There is a set of questions about Probability and Chance for a student to get to know the concept of Probability through the language of change: likely, unlikely, certain, impossible, more likely, less likely, and equally likely, certain, likely, unli
Subjects:
Grades:
5th - 7th
Types:
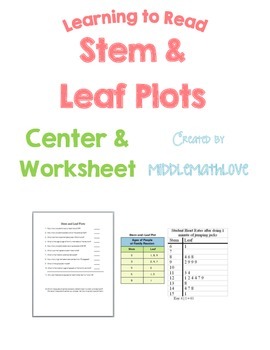
Data Analysis Worksheet - Reading & Analyzing Stem and Leaf Plots
This product is perfect for an introductory or review lesson on understanding how to read stem and leaf plots. Post the data displays on the SmartBoard or print out copies for each student. Students answer questions on the worksheet by reading and analyzing the graphs.
Stem and Leaf Plot Activity Includes:
--1 Stem and Leaf Plot Student Worksheet
--2 slides of Stem and Leaf Plots
I combined this product with my other data analysis worksheets (box and whisker plots and histograms) to create
Subjects:
Grades:
7th - 10th
Types:
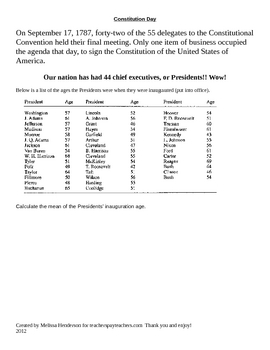
Constitution Day - Math activity
Constitution Day. It is a law that all teachers must teacher the constitution on this day regardless of the content. I developed this activity for my 6th grade students to complete on constitution day. This would also be a great cross curriculum item as well!
Subjects:
Grades:
5th - 7th
Types:
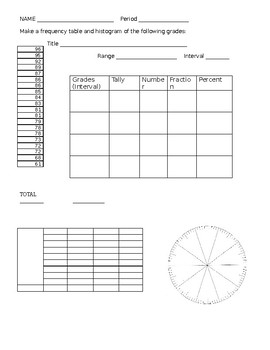
Intro to Frequency Tables - Histogram
This is a student friendly worksheets for students to learn how to collect data and make a frequency table and Histogram and circle graph. First page, set of grades are used as data, then students can fill in the frequency table.
Subjects:
Grades:
5th - 7th
Types:
Showing 1-24 of 408 results


