529 results
Statistics worksheets $5-10
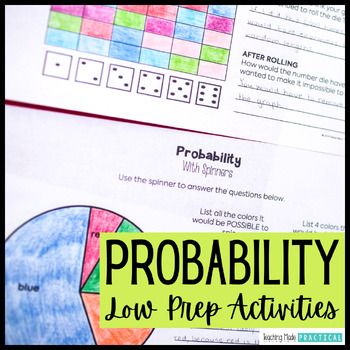
Probability Activities - Fun Review Worksheets, Spinners, Dice, Task Cards
These low prep probability activities and worksheets make a great introduction or review. Students will practice probability vocabulary - certain, impossible, possible, likely, unlikely, and equally likely - and apply these words in a variety of situations and events. Students will also get the opportunity to think about different probability events with hands on practice using spinners, coins, and dice. The fun probability activities include: 6 anchor charts / probability posters to help stu
Subjects:
Grades:
2nd - 5th
Types:
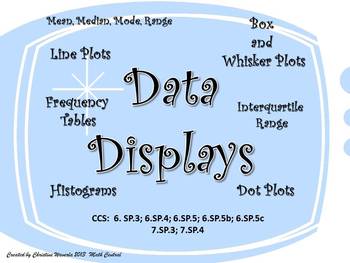
Data Displays: Line Plots, Histograms, Box and Whisker Plots, Frequency Tables
This is one of my favorite teaching tools! I created this Data Display set of worksheets this year for my 6th grade class. My students loved using these worksheets to practice their new skills. Each worksheet provides plenty of room for students to create their data displays and answer questions based on the data. Questions ask students to find the mean, median, mode, range, interquartile range, and percentages.These worksheets are fully aligned with the Common Core Curriculum.CCS: 6.SP.3; 6.SP
Subjects:
Grades:
6th - 8th
Types:
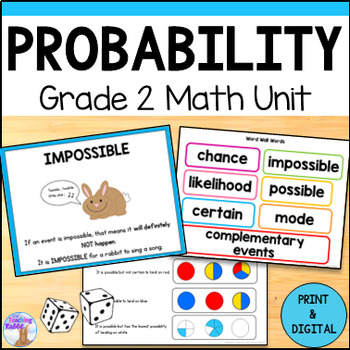
Probability Unit - Activities, Worksheets, & Assessment - Grade 2 Math (Ontario)
This Probability Unit for Grade 2 covers describing the likelihood that events will occur (possible, impossible, certain). It comes with probability posters, lesson ideas, worksheets, task cards, and a unit test.It is based on the 2020 Ontario Curriculum but can be useful for anyone teaching probability concepts (likelihood of events). If you are looking for a more general packet that is useful for Grades 1 - 3, you may be interested in Probability Activities & Worksheets.This resource als
Subjects:
Grades:
2nd
Types:
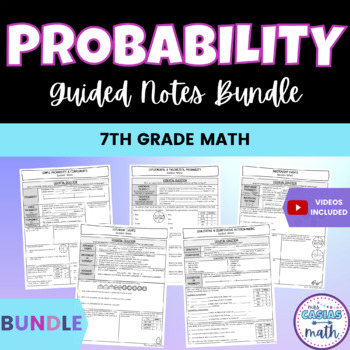
Probability 7th Grade Math Guided Notes Lessons BUNDLE
This bundle includes 8 concise, to the point and no-prep probability lessons. These notes are a great way to teach & introduce: Simple probability and complementsIndependent and dependent events Simulations and predictionsRandom samplingTheoretical and experimental probabilityThese notes are scaffolded and broken down well so that students develop a strong foundation before moving into trickier topics. Students and teachers love how easy these notes are to follow and understand. This bundle
Subjects:
Grades:
7th - 8th
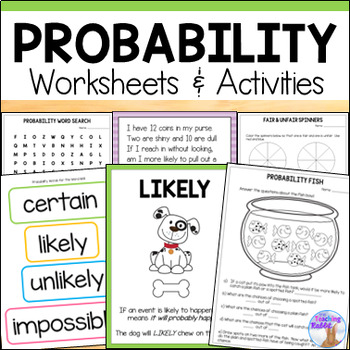
Probability Activities Worksheets & Posters - Likely Unlikely Certain Impossible
Use these fun activities with spinners, coins & dice to introduce and teach probability to your 2nd grade students!This math packet comes with probability worksheets, posters, word problems, task cards, a match game, word wall words like certain, likely, unlikely, and impossible, and a test. Great for independent work, math centers, or small group instruction. This resource is also included in my Data Management Bundle!★ Follow me and be notified when new resources are added to my store!
Subjects:
Grades:
1st - 3rd
Types:
Also included in: Graphing & Probability Activities Data Management Math Bundle
Analyzing Plots, Graphs, and Tables using Measures of Central Tendency
This product provides students the opportunity to analyze data presented in different ways. By making calculations and analyzing data, students make conjectures and justify them using mathematical reasoning and evidence!What is included?This product contains 8 student work pages. Each work page contains a set of data displayed graphically with accompanying questions. The data displays included are 2 dot plots, 2 bar graphs, 2 frequency tables, and 2 stem-and-leaf plots. Students are required
Subjects:
Grades:
5th - 11th
Types:
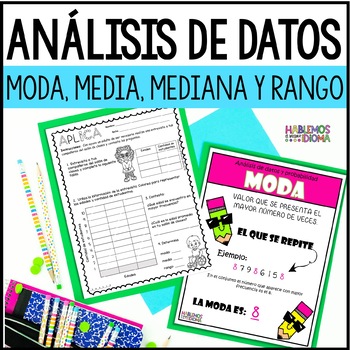
Análisis de datos moda, media, mediana y rango | Interpretación gráficas
¿Necesitas actividades para trabajar con tus estudiantes de grados primarios el análisis de datos (moda, media, mediana y rango) e interpretación de gráficas de una forma sencilla y divertida? Este recurso incluye carteles, hojas de trabajo, plegables para libreta interactiva y más.El siguiente recurso se llevó a cabo con la intención de ofrecer acceso curricular a la destreza de una forma sencilla y atractiva para el estudiante. El recurso se desarrolló para un aula inclusiva está dirigido a
Subjects:
Grades:
4th - 8th
Mean, Median, Mode, and Range (Bundled Unit) - Distance Learning
This is an enjoyable, interactive, and engaging bundled unit covering mean, median, mode, and range (and introduces outliers). This unit is great for 5th and 6th graders and 7th graders who struggle with these concepts.Included in this bundled unit:PowerPointAnimated and fun 4-part, 21-slide PowerPoint (multi-day use)-Part 1 – The Meaning of Mean-Part 2 – Getting in the Middle of Median-Part 3 – Making the Most of Mode-Part 4 – Home, Home on the RangeEach section offers plenty of practice probl
Subjects:
Grades:
5th - 7th
Examining Effects of Outliers on Measures of Central Tendency
This 10-page document contains 3 real-life data sets. For each data set, students are guided through an exploration of how outliers in data affect mean, median, mode, and range. Each data set requires students to perform calculations and analyze data. Students will make conjectures and justify them in writing using mathematical reasoning and evidence.
At the end of the activity, students are asked several concluding questions that require them to analyze and evaluate their work. They focus
Subjects:
Grades:
5th - 9th
Types:
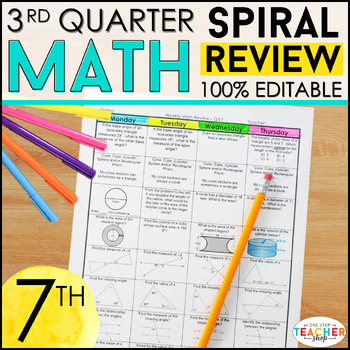
7th Grade Math Spiral Review & Quizzes | Homework or Warm Ups | 3rd QUARTER
This 7th Grade math spiral review resource can easily be used as math HOMEWORK, WARM UPS, or a DAILY MATH REVIEW! This resource was designed to keep math concepts fresh all year and to help you easily track student progress. All pages are 100% EDITABLE and easy to differentiate to fit your students' needs. ★ Get the ENTIRE YEAR BUNDLE! {CLICK HERE} ☝☝ Check out the Preview for more details and 3 FREE Weeks! ☝☝This Spiral Review System is also available for LANGUAGE (Grammar & Word Study)Go 1
Subjects:
Grades:
7th
Types:
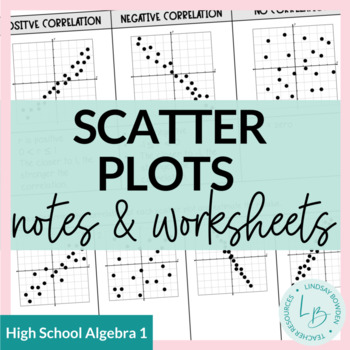
Scatter Plots Notes and Worksheets
These scatter plots notes and worksheets are meant for an Algebra 1 statistics unit. They cover:Linear, Quadratic, and Exponential Scatter Plots (very basic)Linear Scatter Plots in more detail Correlation CoefficientCorrelation vs. CausationLine of Best Fit (estimating from a graph)Linear Regression (using a graphing calculator)10 pages + answer keys.You may also like:Box and Whisker Plots Notes & WorksheetsHistograms Notes & WorksheetsTerms of Use:This product should only be used by the
Subjects:
Grades:
8th - 10th
CCSS:
Also included in: Statistics Unit Bundle
Compound Probability Activity Bundle - Foldable Notes plus 5 Fun Activities
This bundle includes 6 compound probability activities! You will save over 20% by buying this bundle rather than buying each product individually. Please view the individual product descriptions and previews to make sure these activities are appropriate for your classroom.This is a zip file so please be sure you are able to open zip files before downloading this product.***************************************************************************You May Also Like:Theoretical and Experimental Proba
Subjects:
Grades:
6th - 9th
Types:
CCSS:
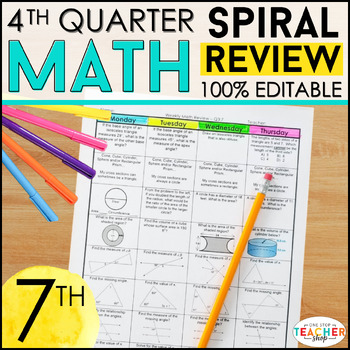
7th Grade Math Spiral Review & Quizzes | Homework or Warm Ups | 4th QUARTER
This 7th Grade math spiral review resource can easily be used as math HOMEWORK, WARM UPS, or a DAILY MATH REVIEW! This resource was designed to keep math concepts fresh all year and to help you easily track student progress. All pages are 100% EDITABLE and easy to differentiate to fit your students' needs.★ Get the ENTIRE YEAR BUNDLE! {CLICK HERE} ☝☝ Check out the Preview for more details and 3 FREE Weeks! ☝☝This Spiral Review System is also available for LANGUAGE (Grammar & Word Study)Go 10
Subjects:
Grades:
7th
Types:
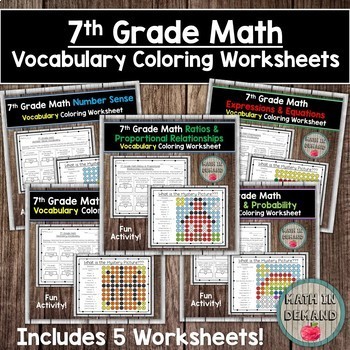
7th Grade Math Vocabulary Coloring Worksheets Bundle
Included is 5 vocabulary coloring worksheets for 7th grade math. They are broken down into the following units:
Unit 1 - Number Sense Coloring Worksheet
Unit 2 - Ratios & Proportional Relationships Coloring Worksheet
Unit 3 - Expressions & Equations Coloring Worksheet
Unit 4 - Geometry Coloring Worksheet
Unit 5 - Statistics & Probability Coloring Worksheet
Vocabulary for each unit is given below:
Unit 1 Number Sense Vocabulary: absolute value, numerator, denominator, quotient, ra
Subjects:
Grades:
7th
Types:
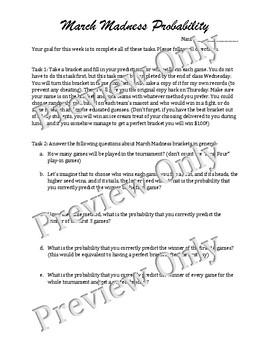
March Madness Probability Project
In this project, students will fill in NCAA March Madness brackets and then analyze them using historical data to find the probability of different outcomes. They will also use a random number table and the historical results of the tournament to fill out a mathematical bracket. This project is perfect if you can time your lessons on probability with the March Madness tournament.
Subjects:
Grades:
7th - 12th
Types:
CCSS:
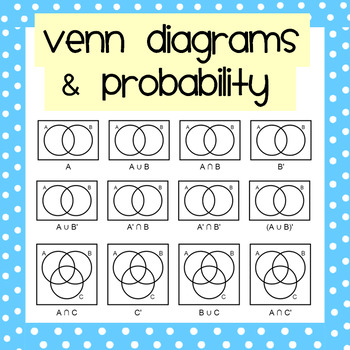
Venn Diagrams & Probability Mega Worksheet Pack
A thorough introduction to shading regions of venn diagrams and using them to calculate probabilities.
Includes 7 worksheets/activities:
1. Understanding intersections, unions and complements of sets.
2 & 3. Probabilities from Venn diagrams: True or False & Matching Questions.
4. Comparing Venn Diagrams, Two-way Tables & Frequency Trees.
5. Completing Venn Diagrams from given information (more difficult).
6. Venn Diagrams & Conditional Probability
7. Recognising exhaustive,
Subjects:
Grades:
9th - 12th
Types:
CCSS:
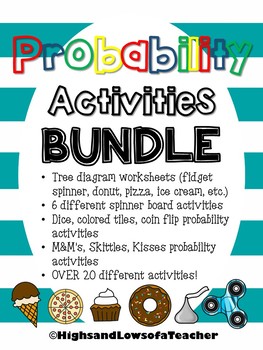
Probability Activity BUNDLE
Buy this bundle and save $!What's included in this bundle--Over 20 different activities-Fidget spinner probability activities-M&M's, Skittles, and Kisses probability activities-Dice, coin flip, colored tiles probability activities-Probability statement worksheets-Tree diagram worksheets-BONUS- fidget spinner and water bottle flip line plot worksheetsFidget Spinner MathTree Diagram WorksheetsSweets Probability ActivitiesColored Tiles, Coin Flip, Dice ActivitiesFREE Water Bottle Flip Line Plot
Subjects:
Grades:
3rd - 8th
Types:
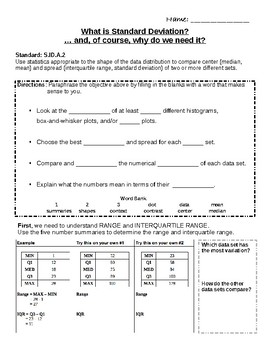
What is Standard Deviation? … and, of course, why do we need it?!
S.ID.A.2 Use statistics appropriate to the shape of the data distribution to compare center (median, mean, mode) and spread (range, interquartile range, variance, and standard deviation) of two or more different sets.
Subjects:
Grades:
7th - 11th
CCSS:
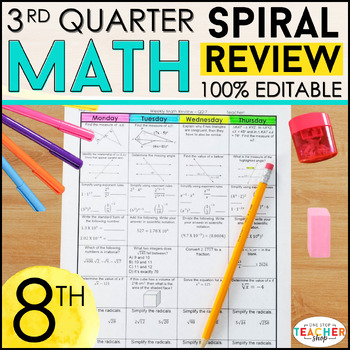
8th Grade Math Review & Quizzes | Homework or Warm Ups | 3rd QUARTER
This 8th Grade math spiral review resource can easily be used as math HOMEWORK, WARM UPS, or a DAILY MATH REVIEW! This resource was designed to keep math concepts fresh all year and to help you easily track student progress. All pages are 100% EDITABLE and easy to differentiate to fit your students' needs.Get the ENTIRE YEAR BUNDLE! {CLICK HERE} ☝☝ Check out the Preview for more details and 3 FREE Weeks! ☝☝This Spiral Review System is also available for LANGUAGE (Grammar & Word Study)Go 100%
Subjects:
Grades:
8th
Types:
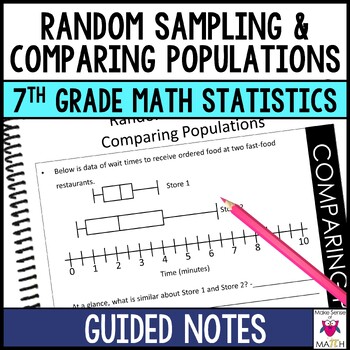
7th Grade Math Statistics Notes Random Sampling and Comparing Populations
Students writing sloppy notes? Improve their engagement and understanding of random sampling and comparing populations. These 7th grade statistics notes focus on how to effectively obtain a random sample from a population and comparing measures of center and measures of variability with two data sets. The data sets are displayed as dot plots and box plots. Also includes vocabulary charts for easy reference. Students will calculate, explain, analyze, and delve into statistics. Save a BUNDLE by p
Subjects:
Grades:
7th - 8th
Also included in: 7th Grade Math Curriculum and Activities Bundle CCSS
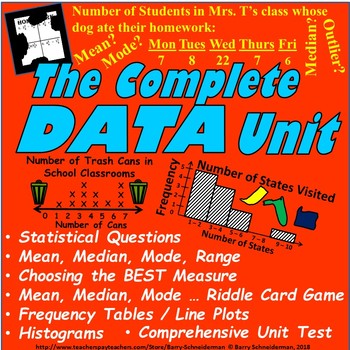
Mean, Median, Mode, Range, Line Plot, Histogram & More Data and Statistics Unit
Mean, median, mode, range, frequency tables, line plots, histograms, statistical questions, determination of the best measure of center, discussion of the impact of outliers .. real-world data and statistics concepts that we often find we are attempting to cram into our curriculum at the end of the school year. This complete data unit, which can be used at any time throughout the year, was created to help reduce this anxiety! In six to eight days, it comprehensively and, using an enjoyable, ea
Subjects:
Grades:
5th - 8th
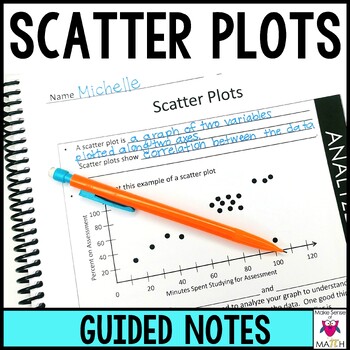
Scatter Plots Guided Notes - Scatter Plots and Line of Best Fit Notes
Save some time with these scatter plots guided notes that dive into correlations, linear associations, outliers, clusters, lines of best fit, and construction of scatter plots. These are perfect for 8th grade math or Algebra class. Your students will have a great undrstanding of scatter plots after going through these notes. IF YOU LIKE THESE NOTES THEN CHECK OUT ALL 8TH GRADE NOTES HERE!These in-depth guided notes contain:1 title page14 pages of guided notesCONTAINS 2 FORMATS: ONE WITH A BLACK
Subjects:
Grades:
8th - 9th
Also included in: 8th Grade Math Curriculum and Activities Bundle CCSS
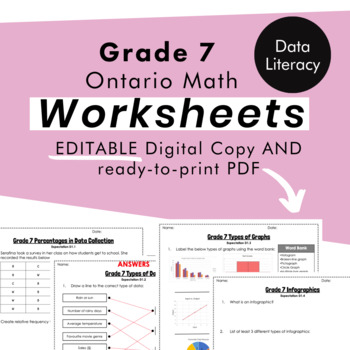
Grade 7 Ontario Math -Data Literacy Worksheets -PDF+FULLY Editable Google Slides
Are you looking for practical and easy to use supplement practice for the NEW Grade 7 Ontario Math Curriculum? These ready-to-print PDF and EDITABLE worksheets is exactly what you need! Note this resource compliments my digital Data Literacy Unit, but can also be used separately! This resource contains 6 worksheets for your students to apply what they have learned in the Data strand for Data Literacy. Each worksheet specifies which Ontario Curriculum Expectation is being covered. *These workshee
Subjects:
Grades:
6th - 8th
Types:
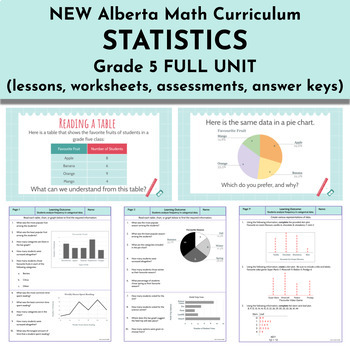
Statistics Unit - NEW Alberta Math Curriculum Grade 5
This Grade 5 Statistics resource is intended to meet the NEW 2023 Alberta Math curriculum expectations. Learning Outcome: Students analyze frequency in categorical data.Skills and Procedures:Examine categorized data in tables and graphs.Determine frequency for each category of a set of data by counting individual data points.Identify the mode in various representations of data.Recognize data sets with no mode, one mode, or multiple modes.Justify possible answers to a statistical question using m
Subjects:
Grades:
5th
Types:
Also included in: FULL YEAR Alberta Math Curriculum - Grade 5
Showing 1-24 of 529 results


