56 results
Free statistics posters
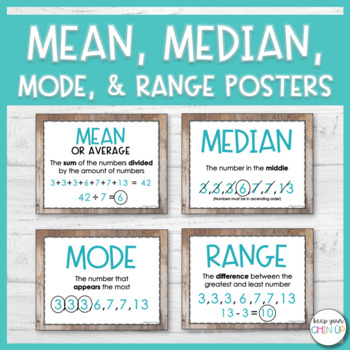
Mean, Median, Mode, and Range Posters
Looking for a visual to help your students with determining the mean, median, mode, and range of a data set? These simple posters are designed to help your students remember key words and formulas for each of the terms.
WHAT'S INCLUDED?
► 2 Options for printing (color or black & white)
► Posters for the terms: mean, median, mode, range, and data set
► Vocabulary worksheet
► Practice worksheet
Subjects:
Grades:
4th - 6th
Types:
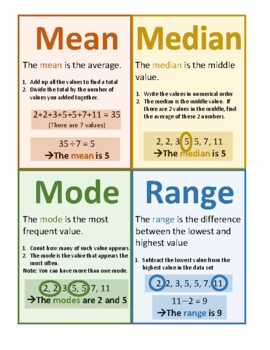
Mean Median Mode Range Poster Notes Anchor Chart
The PDF poster describes mean, median, mode, and range in an easy-to-understand and visual way. Enjoy!Check out my other posters here:STEM: Women in STEM Insp. Quotes, Women in STEM, Careers, Heroes Timeline, Inspirational Quotes from STEM HeroesABCs of Math: STEM Innovations, Amazing STEM facts, Careers, Shapes, in Nature Modern Style, in Nature Vintage Style, in Everyday LifeMath Vocabulary Alphabet: Elementary, Middle School, High SchoolMath in Art: Set A, Set B, Big BundleMath Modelling: Se
Subjects:
Grades:
5th - 9th
Types:
Mean Absolute Deviation Step-by-Step Posters FREEBIE CCSS 6.SP.5c Aligned**
Mean Absolute Deviation (MAD) can turn even the biggest math lovers into frustrated students without guidance. This topic is relatively new to the 6th Grade curriculum, so it can seem really daunting to teach as well! This free download gives step by step instructions (with examples) to make this math concept easier for you and your students! Perfect for a bulletin board, or to print multiple pages on a sheet (found in your Print settings) to include in a math notebook!
For use with CCSS 6.S
Subjects:
Grades:
6th
CCSS:
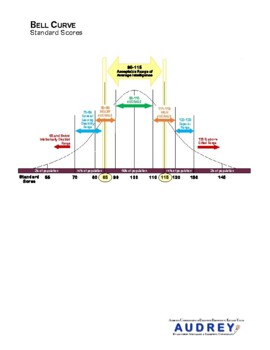
Special Education Evaluation Bell Curve SpEd Evaluation Diagnostician
Graphic to help explain standard scores to parents. See my other listings with the full version that contains information for parents.
Subjects:
Grades:
Not Grade Specific
Types:
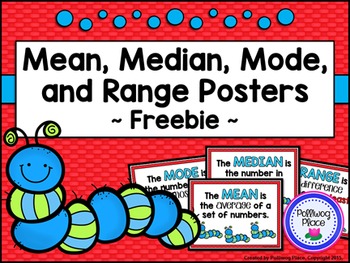
Mean Median Mode and Range Posters {Free}
Mean, Median, Mode, Range Posters {Freebie}
These Mean, Median, Mode, and Range Posters are a set of 4 printable posters that focus on the statistics concepts of mean, median, mode, and range. Each poster comes in both color and black & white.
These posters coordinate with Mean, Median, Mode, and Range Task Cards.
If you like this free poster set, please leave feedback. I love reading about how products are being used.
Thank you! -- Polliwog Place
_____________________________________
Subjects:
Grades:
4th - 6th
Types:
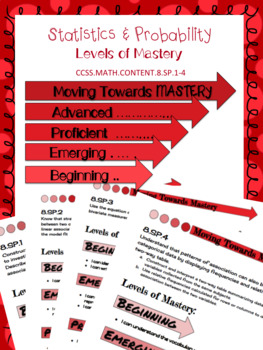
8.SP Scatter Plot & Two-Way Table Levels of Mastery
This product was created to use as an introduction to teaching the eighth grade statistics and probability standards. It allows students to evaluate themselves throughout the process of teaching the standards. It can be printed and provided to each student or printed as posters to be hung in the classroom for easy reference.
Levels of mastery are:
→ Beginning
→ Emerging
→ Proficient
→ Advanced
Levels of Mastery Posters:
★ 8.SP.1 Constructing & Interpreting Scatter Plots
★ 8.SP.2 Line of
Subjects:
Grades:
8th, Higher Education
Types:
CCSS:
Also included in: 8th Grade Math Common Core Growing Bundle
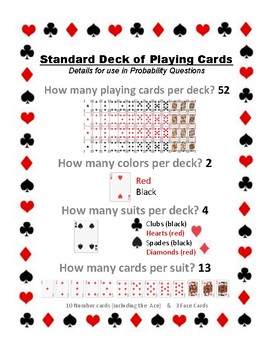
Deck of Playing Cards info, Journal Insert for Probability Questions
When teaching my 7th graders probability, I was surprised to find that many did not know what types of cards where in a standard deck of playing cards. So I created this insert for their journals as a reference.
The inserts can be printed in color or black and white. There are three files within the zip file. They include a full page copy for ease of projection, 2 per page copy and 4 per page copy for the students' journals. This gives you the freedom to decide how large you want their journal
Subjects:
Grades:
5th - 8th
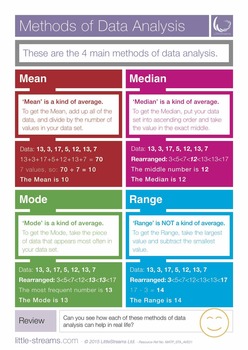
Methods of Data Analysis | Poster on Mean, Median, Mode and Range
This is a simple and completely FREE poster on the four common methods of data analysis. It states simply how to find each.
You may also like:
Mean, Median and Mode Bingo
Averages Follow Me Cards
Mean Wars Averages Card Game
If you have any comments or suggestions, and to stay updated please follow us or take a look at our Facebook Page
Please click here to visit our website for more information about LittleStreams
Subjects:
Grades:
5th - 8th, Adult Education
Types:
CCSS:
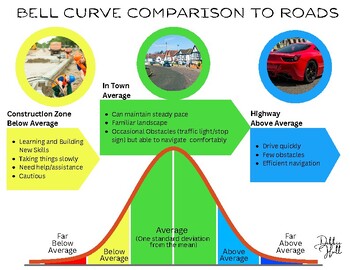
Bell Curve Comparison/Analogy to Roads
Embark on a journey of comprehension with this printable document, designed to demystify the complexities of standard curve data interpretation using a relatable road analogy. This image serves as a valuable resource for evaluation meetings, educational settings, or any scenario where understanding statistical distributions is paramount. You can use this image to explain standard scores to students, parents and staff. In the realm of driving, imagine your skill level as the journey on a road.
Grades:
Not Grade Specific
Types:
![Preview of STEM Poster, Manga Style, Math Expected Value (Digital format [JPEG], 12"x18")](https://ecdn.teacherspayteachers.com/thumbitem/STEM-Poster-Manga-Style-Math-Expected-Value-Digital-format-JPEG-12-x18--10922409-1705759177/original-10922409-1.jpg)
STEM Poster, Manga Style, Math Expected Value (Digital format [JPEG], 12"x18")
These are a set of colorful posters (12 total) which feature kids (teens) who are engaging in a hobby/interest of theirs and also includes a relevant mathematical or scientific equation (e.g. Construction and the Pythagoreon Theorem).This is to show that math/science is in everyday life even if in the background.This one is "Lucky". His hobby is gaming and his equation is the Expected Value equation used in probability and statistics.The best way to print these images is to go to your local prin
Subjects:
Grades:
Not Grade Specific
Types:
Culminating Data Collection Project
This project is great for an end-of-semester culminating project. Students will design a study, gather data, then display and describe what they have discovered. As a bonus, you will receive lots of great displays for your classroom!
Subjects:
Grades:
10th - 12th
![Preview of STEM Poster, Manga Style, Math Regression (Digital format [JPEG], 12"x18")](https://ecdn.teacherspayteachers.com/thumbitem/STEM-Poster-Manga-Style-Math-Regression-Digital-format-JPEG-12-x18--10922483-1705759898/original-10922483-1.jpg)
STEM Poster, Manga Style, Math Regression (Digital format [JPEG], 12"x18")
These are a set of colorful posters (12 total) which feature kids (teens) who are engaging in a hobby/interest of theirs and also includes a relevant mathematical or scientific equation (e.g. Construction and the Pythagoreon Theorem).This is to show that math/science is in everyday life even if in the background.This one is "Florence". Her hobby is chemistry and her equation is the Regression equation.The best way to print these images is to go to your local print shop, and have them print on 12
Subjects:
Grades:
Not Grade Specific
Types:
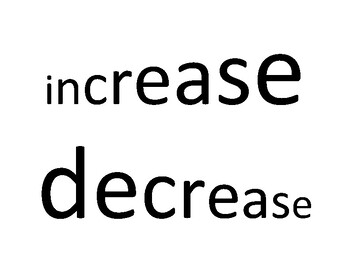
INCREASE vs DECREASE Poster
You can post this around your room to remind students that INCREASING is going from smaller to larger while DECREASING goes from largest to smallest. For example...What does increasing temperature mean? or List the levels of the ecosystem in decreasing order.
Subjects:
Grades:
Not Grade Specific
Types:
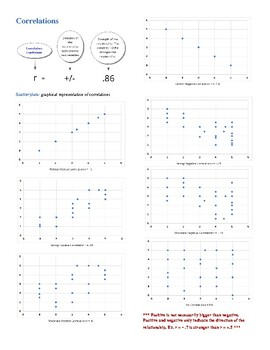
Correlations Visual
Help your students understand correlation coefficients and how to read scatterplots with this simple visual.
Subjects:
Grades:
10th - 12th
Types:
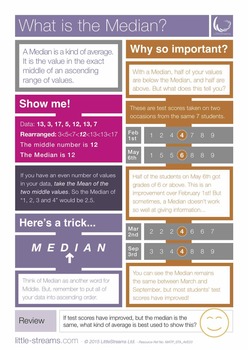
What is the Median? | Free Poster
A completely FREE poster on the Median, it's benefits and its downsides.
You may also like:
Mean, Median and Mode Bingo
Averages Follow Me Cards
Mean Wars Averages Card Game
If you have any comments or suggestions, and to stay updated please follow us or take a look at our Facebook Page
Please click here to visit our website for more information about LittleStreams
Subjects:
Grades:
5th - 8th, Adult Education
Types:
CCSS:
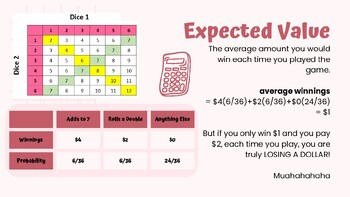
Expected Value Activity
Use this fun slide to help you gamify Expected Values with probabilities. Give your students fake money and have them roll the die. The game is in your favor, so no stress, you'll end up winning in the long run!
Subjects:
Grades:
10th - 12th
Types:
CCSS:
NGSS:
HS-LS4-1
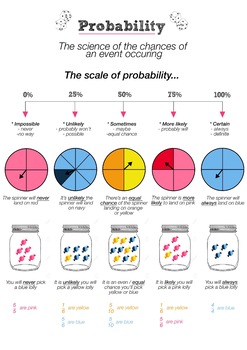
Probability Poster for year five and six CREATED IN A1 SIZE
This anchor poster created in A1 size is essential to teaching probability to year five and six. This resource aligns with the curriculum of statistic and probability and is designed to scaffold learning.
Subjects:
Grades:
4th - 6th
Types:
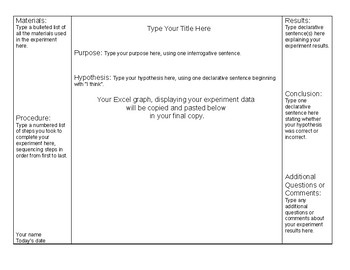
Scientific Method Mini Trifold Board Template
Students can create mini trifold boards, to display any science experiment using the Scientific Method format with this Word document template.
Teachers can save and share this with their students using public file storage available on school servers, Google Drive, etc.
This classroom-tested template was used for a Valentine Candy Heart Investigation project I developed. Student sample work may be viewed on my classroom web site here:
http://www.mrsdingman.com/Vday_Mini_Tri-Fold_Julia.pdf
htt
Subjects:
Grades:
5th - 8th
Types:
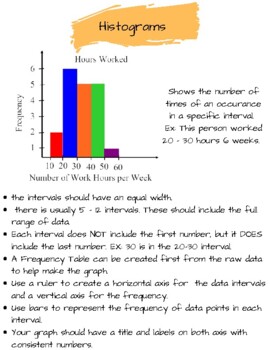
Histograms Anchor Chart
This anchor chart shows a model for a histogram with tips and tricks to be successful in creating one.
Subjects:
Grades:
9th - 12th
Types:
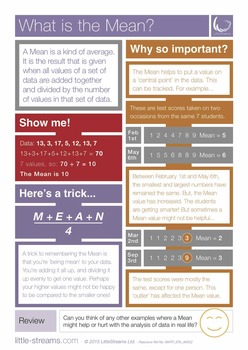
What is the Mean? | Free Poster
A completely FREE poster on what the Mean in statistics is, why it's important and it's properties.
You may also like:
Mean, Median and Mode Bingo
Averages Follow Me Cards
Mean Wars Averages Card Game
If you have any comments or suggestions, and to stay updated please follow us or take a look at our Facebook Page
Please click here to visit our website for more information about LittleStreams
Subjects:
Grades:
5th - 8th, Adult Education
Types:
CCSS:

What is the Range? | Free Poster
A completely FREE poster on the Range in data analysis, it's benefits and its downsides.
Click here to take a look at our popular Averages Card Game
And our new Statistics Bingo game
If you have any comments or suggestions, and to stay updated please follow us or take a look at our Facebook Page
Please click here to visit our website for more information about LittleStreams
Subjects:
Grades:
5th - 8th, Adult Education
Types:
CCSS:

What is the Mode? | Free Poster
A completely FREE Poster on the Mode, it's benefits and its downsides.
You may also like:
Mean, Median and Mode Bingo
Averages Follow Me Cards
Mean Wars Averages Card Game
If you have any comments or suggestions, and to stay updated please follow us or take a look at our Facebook Page
Please click here to visit our website for more information about LittleStreams
Subjects:
Grades:
5th - 8th, Adult Education
Types:
CCSS:
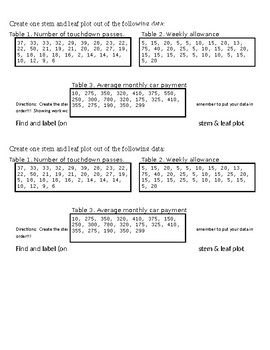
Stem and Leaf Football
Students will create their own stem and leaf plot using the data given. The directions are attached...poster paper, rulers and colored utensils will be needed!!Great for subs, days with a half of your classes or just plain ole' review!
Subjects:
Grades:
6th - 8th
Types:
Showing 1-24 of 56 results


