6 results
Free statistics clip arts
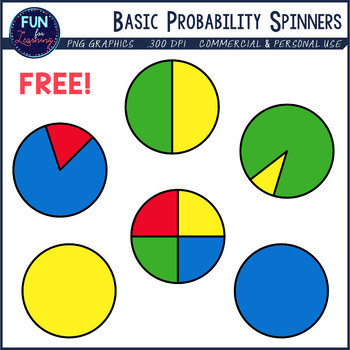
Statistics Clipart - PROBABILITY SPINNERS
FREE! There are 2 graphics for each of the following probability terms:
~ Certainly/ Impossible
~ Very Likely/ Very Unlikely
~ Equal Chance
______________________________________________________________________________________
This clipart collection includes a commercial use license that allows you to use these graphics to develop original digital download products to sell on TpT, Boom Learning, and similar online forums. For products that are intended to be printed, the graphics must be "l
Subjects:
Grades:
Not Grade Specific
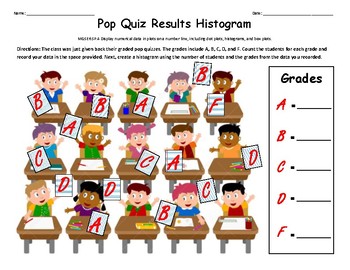
Histogram Pop Quiz
Histogram activity for standard:MGSE6.SP.4 Display numerical data in plots on a number line, including dot plots, histograms, and box plots.
Subjects:
Grades:
5th - 7th
Types:
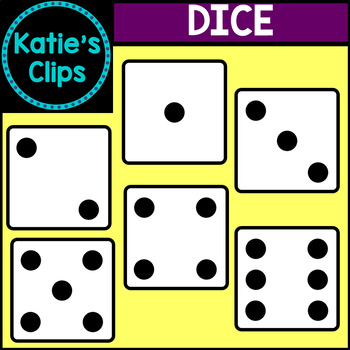
Dice Clipart
Included in this set are 6 dice images.
All images are in png format with transparent backgrounds so you can easily layer them into your projects.
This product is part of my Math Clipart Bundle where you can purchase the entire set of math clipart at a discount!
Subjects:
Grades:
PreK - 5th
Also included in: Math Clipart Bundle
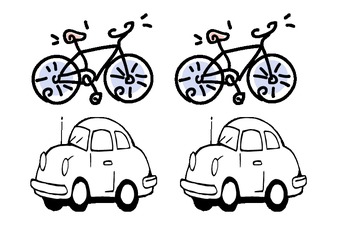
Picture Graph Pics - How the class travels to school
This is just a 4 page resource of pictures I used to introduce picture graphs to my year 1's.
There are four different pics - A bus, a car, a bike and someone walking.
I told the students that we were going to make a picture graph of how our class travels to school. We first made a tally table on the board and then students got the picture that matched their method of transport they take to school and got to colour it in. Once everyone had finished we made a big whole class picture graph.
A
Subjects:
Grades:
K - 2nd
Types:
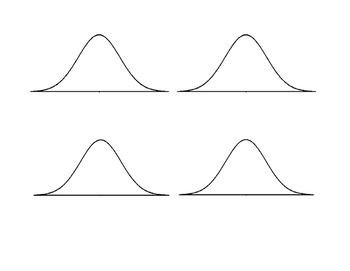
Blank Normal Curves
Four normal curves in a landscape MS Word document. Can be copied and pasted to PowerPoint. Click and drag a corner to resize. Click and drag an edge to change depiction of variance.
Subjects:
Grades:
9th - 12th, Higher Education, Adult Education
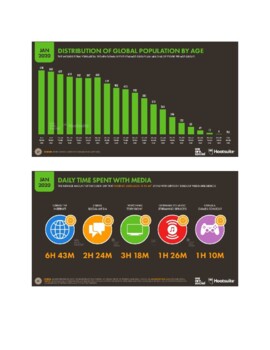
Free Internet / Mobile Device Usage
Pictures and graphs really help visual learners understand all the numbers and statistics in a lesson. These pictures and graphs were combined in one document for easy access. This document provides you with some basic numbers, charts and graphics based on current studies about the internet and usage in the world today. It helps bring focus to learners and show just how connected we really are.
Subjects:
Grades:
Not Grade Specific
Types:
Showing 1-6 of 6 results


