260 results
3rd grade graphing worksheets for Microsoft Word
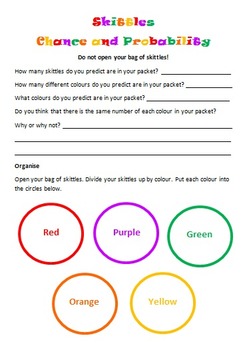
Skittles Chance and Probability (Editable)
Chance and Probability activity using yummy Skittles!!!
Students are to predict the colours and quantities before they open the skittles bag. Students are to complete a chance experiment where they use a tally to collect their data. Students then transfer their data in fractions, decimals and percentages. Students are to create a bar graph using their data as well as answer chance and probability questions about the data. I used this with my grade 5/6 students and they loved it!
Subjects:
Grades:
3rd - 10th
Types:
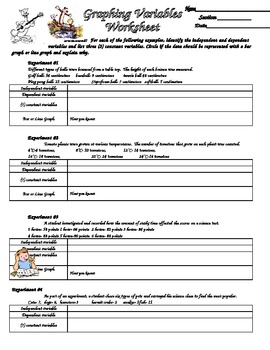
Scientific Method Variables and Graphing Practice
Students are given six different sets of experimental data and asked to identify the variables (independent, dependent etc.). They also reinforce graphing by identifying if the data should be represented with a bar or line graph. With this information, students the create data tables and graphs for the data.
Subjects:
Grades:
3rd - 12th
Types:
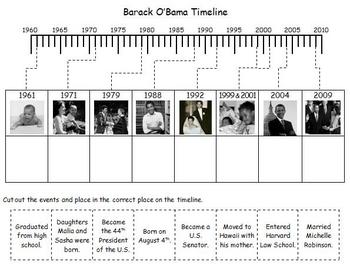
President's Day - Barack Obama Photo Timeline
Students will learn about the important events in Barack Obama's life as they complete this photo timeline. Two versions are included, one for upper elementary and one for lower elementary.
Subjects:
Grades:
1st - 6th
Making Science Charts and Graphs
A simplified look at making charts and organizing data in science.
-Data Charts
-Circle Graphs
-Bar Graphs
-Line Graphs
-Key Vocabulary List
-Quiz/Assessment
-Activity - Practice
-Teacher answer key for quiz and activity
Thanks for taking the time to stop by my store!
Mrs. Degs
Teaching Science Well
Blog: http://teachingsciencewell.wordpress.com/
Facebook: https://www.facebook.com/TeachingScienceWell
TPT: http://www.teacherspayteachers.com/Store/Teaching-Science-Well-Science-Resources
Pi
Subjects:
Grades:
3rd - 10th
ACT ASPIRE - Test Prep - Practice - Reading Graphs/Data Interpretation Exemplar
Students will read a short passage and use different types of tables and graphs to answer questions. A great resource for AMI day. Distance Learning. Keywords- ACT, ACT ASPIRE, SCIENCE, GRAPHS, ACT Aspire like questions, Test Prep
Subjects:
Grades:
3rd - 9th
Types:
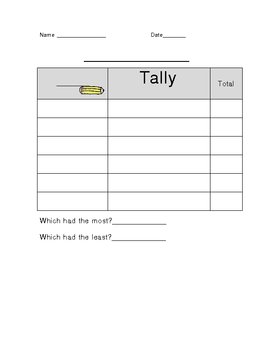
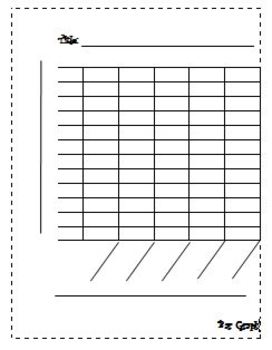
Blank Tally Chart
This Tally Chart can be used in numerous classroom situations. It will help students practice counting with tallies, graphing, etc.
Subjects:
Grades:
PreK - 6th
Types:
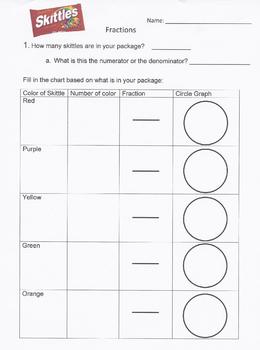
Fractions with Skittles
This activity uses skittles to help introduce fractions to them. It introduces to them the understanding of numerator and denominator. The students will be given an opportunity to write the fraction and use a circle graph to show the fraction.
Subjects:
Grades:
3rd - 5th
Types:
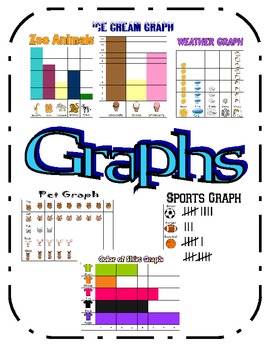
Graphs (Picture, Bar and Tally Marks)
These picture, bar and tally mark graphs can be used in a variety of ways. They can be used to display in a calendar area where you can review daily graphing questions during your calendar time. The students can use the graphs to learn how to write a question about a graph. Worksheets could be created to go with each graph. These graphs could be used in several different grade levels. For example, these graphs relate to the first grade math common core standard 1.MD.4 (Organize, represent,
Subjects:
Grades:
1st - 3rd
Types:
Double Bar Graph, Data Collection & Analysis Questions: Favorite pizza topping
I created this assignment for my math class during our data and graphing unit. This is the higher differentiation, you can find the lower in my store as well. There are 3 worksheets included. The first sheet is a tally chart for collecting data on peer and classroom staff's pizza topping preferences. The second is analysis questions for the tally data that the students collect. The last is a double bar graph to graph the data documented on the data sheet. For this activity I had my students use
Subjects:
Grades:
3rd - 5th
Types:
Activities and Games to Teach Self-Regulation: Ideas for Your Elementary Student
A packet of activities/games that can be used in your elementary classroom to help students learn self-regulation, impulse control, making good choices, waiting their turn, and giving words to feelings/emotions.Includes: Games/Activities; Writing ideas; Drawing/Doodling; Discussion Topics; Graphing; Making a Choice worksheets; and more.Can be adapted to many different learning levels by the educator."A wonderful resource for teaching skills for the real world, outside school."
Subjects:
Grades:
2nd - 6th
Types:
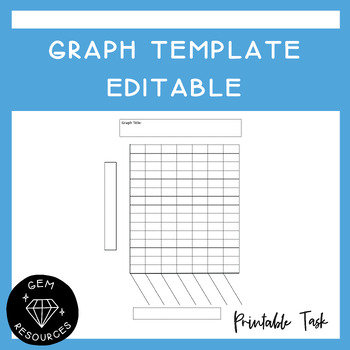
Graph Template Data and Statistics Maths Histogram Bar Column Drawing Editable
Students can use this to help them draw up a graph. It allows them to be accurate and has boxes for the titles needed for the graph.This Word document is editable.
Subjects:
Grades:
2nd - 6th
Types:
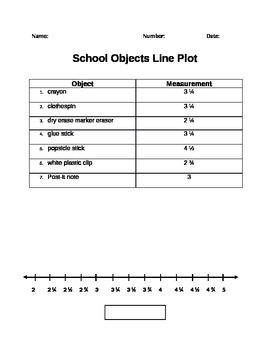
FREE! Measure and Plot - Line Plot Worksheet
CCSS.MATH.CONTENT.3.MD.B.4
Generate measurement data by measuring lengths using rulers marked with halves and fourths of an inch. Show the data by making a line plot, where the horizontal scale is marked off in appropriate units— whole numbers, halves, or quarters.
Editable measure and plot worksheet.
Subjects:
Grades:
3rd
Types:
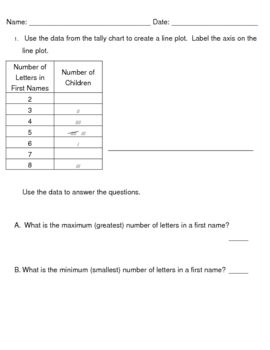
Everyday Math, Grade 3, Unit 3, Tally Chart-Line Plot-Data Practice
Simple 2 question practice to use as a review for students who may need a little bit more help understanding converting data in a tally chart into a line plot. There are questions related to the data about the maximum, minimum, range, and median. It's free, so enjoy it!
Subjects:
Grades:
2nd - 4th
Types:
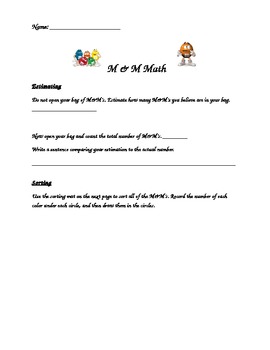
M & M Math Packet
This packet is designed for upper elementary students and includes concepts such as estimating, fractions, probability, and graphing two ways. For this activity, my students would use the fun size pack of M&M's.
Subjects:
Grades:
3rd - 6th
Types:
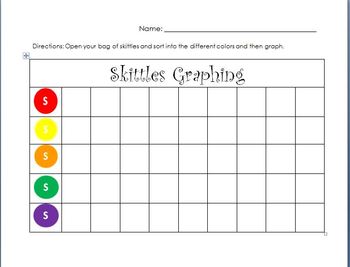
Graphing Skittles Printable
Use this Skittles graph as a companion to my Graphing Powerpoint. Either individually or in groups, have the students open up a red bag of skittles, sort, and then graph the results. Can go over results whole group using powerpoint.
Grades:
1st - 3rd
Types:
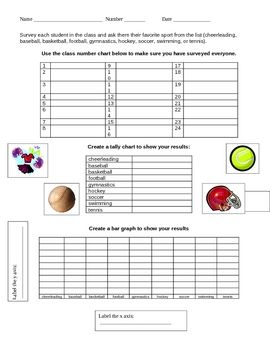
Create a Bar and Pictograph From a Sports Survey
In this graphing activity, students will first survey their classmates to determine their favorite sport. They will then create a bar graph and a pictograph from the data. If you like this idea, please leave feedback! Thank you.
Subjects:
Grades:
2nd - 5th
Types:
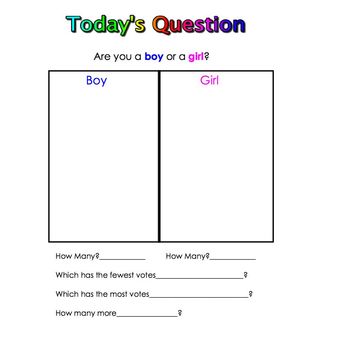
50 Questions of the Day
This is a set of 50 questions of the day to use during Center Time. Students put a sheet on a clip board and poll the other students in class. Students vote on question of the day by writing their name in the correct box or using tally marks. After all students have voted, together class counts and records results at bottom of page. The page can be copied and sent home so each child has a copy of class results to share with parents. My students love to have their turn to be the one who polls the
Grades:
PreK - 3rd
Types:
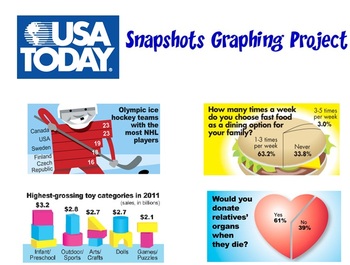
USA Today Snapshots Graphing Project - Technology Integration, and Creative Art
Check out the the thumbnails for a sample of the fun your students will have!
The USA Today newspaper features fun graphs called Snapshots. Visit their online site to view dozens for free.
With this multiple day project, your kids can view fun, artistic examples of a wide range of data displays. They can conduct a survey using their own questions or one from the list I have provided. Next, they can create graphs by hand using the handouts in this packet, and/or they can create them online
Subjects:
Grades:
3rd - 10th
Types:
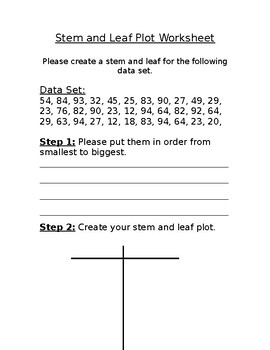
Stem and Leaf Plot Worksheet
Worksheet with a data set to create a stem and leaf plot.
Grades:
3rd - 4th
Types:

2nd & 3rd Grade Math Assessment
This is a 2nd and 3rd grade math assessment including basic operations, word problems, money, measurement, graphing and much more. This was designed for special education students working from an IEP written on the CLASS program as each section is marked with a CLASS objective number. There are 18 pages total.
Grades:
2nd - 3rd
Types:
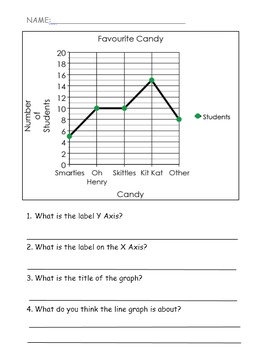
Line Graph: Favorite Candy Quiz
Line graph for primary students
Can be used as a quiz or as diagnostic for students.
Ask students to identify different parts of a line graph (X axis/Y axis)
Students need to analyze the graph to generate statements about the information in the graph.
Subjects:
Grades:
1st - 4th
Types:

Welcome Back to School Glyph Activity
In this fun back to school math activity, students will create a "glyph" of themselves by including items on the picture that represent them (ie. hair color, birth order, month of birth, etc.). Students can then have fun comparing their glyphs to their classmates. This activity can be used with the Reading the Back to School Glyph created by Rencharee. This is in editable format!
If you like this idea, please leave feedback! Thank you.
Subjects:
Grades:
2nd - 5th
Types:
Showing 1-24 of 260 results


