314 results
3rd grade graphing worksheet microsofts
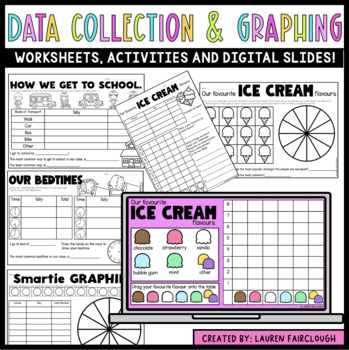
Data Collection and Graphing
Your students are going to LOVE learning all about Data Collection and Graphing with this FUN, HANDS ON pack! 10 topics are included and each includes a variety of worksheets and activities for students to collect and display data!A digital PowerPoint presentation with a number of interactive digital data collection tables and displays is also included! Please see the preview for a closer look at what is included! There are AU and US spelling versions included.
Grades:
K - 3rd
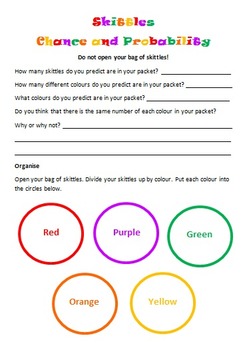
Skittles Chance and Probability (Editable)
Chance and Probability activity using yummy Skittles!!!
Students are to predict the colours and quantities before they open the skittles bag. Students are to complete a chance experiment where they use a tally to collect their data. Students then transfer their data in fractions, decimals and percentages. Students are to create a bar graph using their data as well as answer chance and probability questions about the data. I used this with my grade 5/6 students and they loved it!
Subjects:
Grades:
3rd - 10th
Types:
3rd and 4th Grade Multi-Step Word Problems-(200 Problems)
This packet includes over 200 word problems working on these skills:• 2 and 3 digit addition/subtraction • Carrying/Borrowing• Multi-steps• Graphing skills-Pictographs, Bar Graphs, Line Graphs, & Pie Graphs • Language-“Dozen, Half, Twice” and other key vocabulary for word problems• Other sheets that include problem solving skills• Lining up decimals using money• Place value• Multiplication/Division concepts and basic understandingThis is a PDF that includes a little over 200 multi-step word
Subjects:
Grades:
3rd - 5th
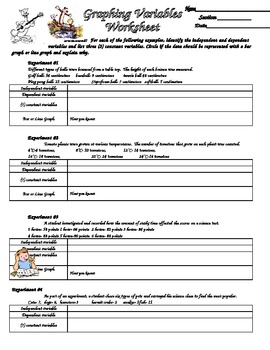
Scientific Method Variables and Graphing Practice
Students are given six different sets of experimental data and asked to identify the variables (independent, dependent etc.). They also reinforce graphing by identifying if the data should be represented with a bar or line graph. With this information, students the create data tables and graphs for the data.
Subjects:
Grades:
3rd - 12th
Types:
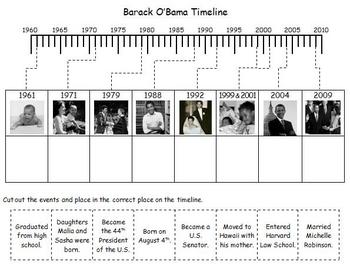
President's Day - Barack Obama Photo Timeline
Students will learn about the important events in Barack Obama's life as they complete this photo timeline. Two versions are included, one for upper elementary and one for lower elementary.
Subjects:
Grades:
1st - 6th
Making Science Charts and Graphs
A simplified look at making charts and organizing data in science.
-Data Charts
-Circle Graphs
-Bar Graphs
-Line Graphs
-Key Vocabulary List
-Quiz/Assessment
-Activity - Practice
-Teacher answer key for quiz and activity
Thanks for taking the time to stop by my store!
Mrs. Degs
Teaching Science Well
Blog: http://teachingsciencewell.wordpress.com/
Facebook: https://www.facebook.com/TeachingScienceWell
TPT: http://www.teacherspayteachers.com/Store/Teaching-Science-Well-Science-Resources
Pi
Subjects:
Grades:
3rd - 10th
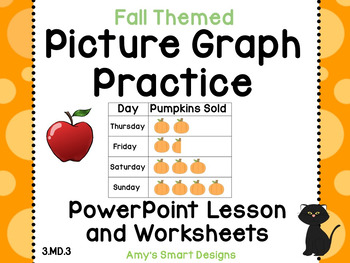
Picture Graphs: Fall Themed PowerPoint/SMARTBoard lesson and Worksheets
This fall themed bundle contains a 15 slide Picture Graph lesson in two formats: PowerPoint and SMART Board. The lesson teaches students the parts of a picture graph, reading picture graphs, constructing their own picture graphs, and giving surveys.
Also included is a packet of 11 worksheets to fit the lesson. Two pages are to be used in class with the screen slides to keep the students engaged while learning and to assess their learning. The remaining worksheets are for independent practi
Grades:
2nd - 3rd
CCSS:
Line Plot Powerpoint and Worksheet
This powerpoint goes over what a line plot is and how to answer questions about it. It starts by showing a completed line plot and asks questions about it. The next line plot shows you how to use a table of data to fill out a line plot. There are also questions to go along with it. The last line plot shows you how to collect data and use it to fill out a line plot. There is a page where you can print out for the students to fill out the data and the line plot with you. There is also a page of qu
Subjects:
Grades:
2nd - 3rd
CCSS:
ACT ASPIRE - Test Prep - Practice - Reading Graphs/Data Interpretation Exemplar
Students will read a short passage and use different types of tables and graphs to answer questions. A great resource for AMI day. Distance Learning. Keywords- ACT, ACT ASPIRE, SCIENCE, GRAPHS, ACT Aspire like questions, Test Prep
Subjects:
Grades:
3rd - 9th
Types:
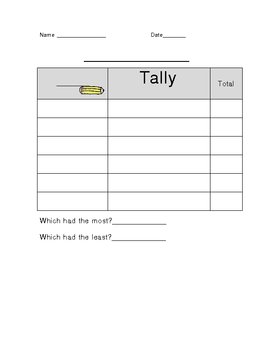
Blank Tally Chart
This Tally Chart can be used in numerous classroom situations. It will help students practice counting with tallies, graphing, etc.
Subjects:
Grades:
PreK - 6th
Types:
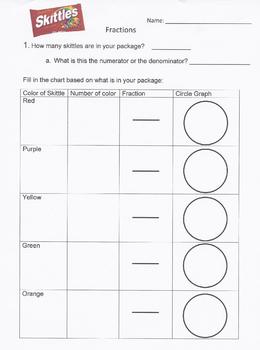
Fractions with Skittles
This activity uses skittles to help introduce fractions to them. It introduces to them the understanding of numerator and denominator. The students will be given an opportunity to write the fraction and use a circle graph to show the fraction.
Subjects:
Grades:
3rd - 5th
Types:
Dot Plots Line Plots Worksheets Presentation Frequency Tables Statistics
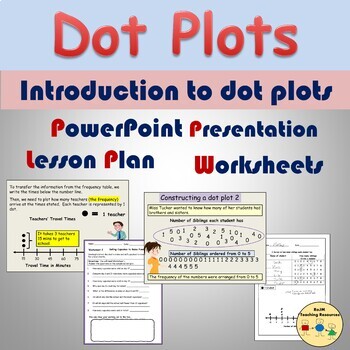
This resource relates to statistics on the topic of dot plots. It introduces dot plots on PowerPoint (12 Slides). The presentation demonstrates how the data was collected, rearranging data in numerical order, and presenting the data on a frequency table. Using the information on the frequency table, students are shown how to create a dot plot/line plot via Slide Show animation. Two detailed examples are shown. Content:· PowerPoint Presentation (12 Slides)· 1 Flexible Lesson Plan (1- 2 hrs)· 2 Se
Subjects:
Grades:
3rd - 5th
Graphs (Picture, Bar and Tally Marks)
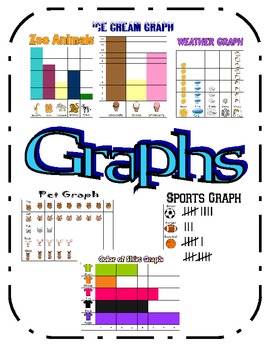
These picture, bar and tally mark graphs can be used in a variety of ways. They can be used to display in a calendar area where you can review daily graphing questions during your calendar time. The students can use the graphs to learn how to write a question about a graph. Worksheets could be created to go with each graph. These graphs could be used in several different grade levels. For example, these graphs relate to the first grade math common core standard 1.MD.4 (Organize, represent,
Subjects:
Grades:
1st - 3rd
Types:
Graphing SOL Powerpoint & Note-taking Review
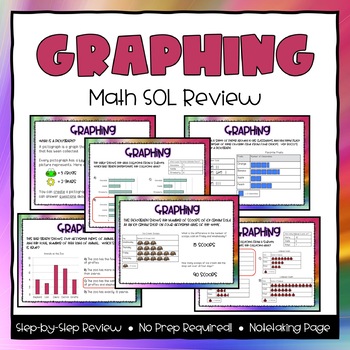
This product features a 15-page powerpoint to review: - Collecting, organizing, and representing data in bar graphs - Collecting, organizing, and representing data in pictographsIt also comes with 3 note-taking pages that go along with the powerpoint. Easy to print and use!
Subjects:
Grades:
2nd - 4th
Also included in: 3rd Grade Math SOL Powerpoint & Note-taking Review Bundle
Double Bar Graph, Data Collection & Analysis Questions: Favorite pizza topping
I created this assignment for my math class during our data and graphing unit. This is the higher differentiation, you can find the lower in my store as well. There are 3 worksheets included. The first sheet is a tally chart for collecting data on peer and classroom staff's pizza topping preferences. The second is analysis questions for the tally data that the students collect. The last is a double bar graph to graph the data documented on the data sheet. For this activity I had my students use
Subjects:
Grades:
3rd - 5th
Types:

3.MD.3 Making Bar Graphs and Pictographs
This 11 page powerpoint includes making and answering questions about bar/pictographs. Student will not only be asked to analyze the data shown, but will have to create their own bar graphs. Two worksheets are attached at the end of the power point so that students can do the problem right along with the teacher.
Power Point Includes:
Student Friendly Objective
Bar Graph Analysis
Picture Graph Analysis
Make a Bar Graph from a given set of data
Make a Picture Graph from a given set of data.
Subjects:
Grades:
2nd - 4th
Types:

Activities and Games to Teach Self-Regulation: Ideas for Your Elementary Student
A packet of activities/games that can be used in your elementary classroom to help students learn self-regulation, impulse control, making good choices, waiting their turn, and giving words to feelings/emotions.Includes: Games/Activities; Writing ideas; Drawing/Doodling; Discussion Topics; Graphing; Making a Choice worksheets; and more.Can be adapted to many different learning levels by the educator."A wonderful resource for teaching skills for the real world, outside school."
Subjects:
Grades:
2nd - 6th
Types:
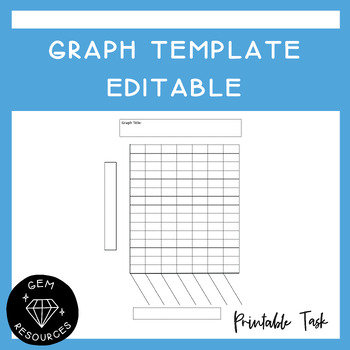
Graph Template Data and Statistics Maths Histogram Bar Column Drawing Editable
Students can use this to help them draw up a graph. It allows them to be accurate and has boxes for the titles needed for the graph.This Word document is editable.
Subjects:
Grades:
2nd - 6th
Types:
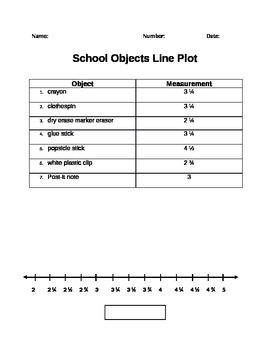
FREE! Measure and Plot - Line Plot Worksheet
CCSS.MATH.CONTENT.3.MD.B.4
Generate measurement data by measuring lengths using rulers marked with halves and fourths of an inch. Show the data by making a line plot, where the horizontal scale is marked off in appropriate units— whole numbers, halves, or quarters.
Editable measure and plot worksheet.
Subjects:
Grades:
3rd
Types:
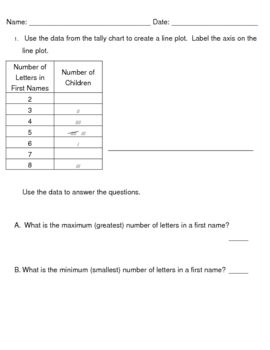
Everyday Math, Grade 3, Unit 3, Tally Chart-Line Plot-Data Practice
Simple 2 question practice to use as a review for students who may need a little bit more help understanding converting data in a tally chart into a line plot. There are questions related to the data about the maximum, minimum, range, and median. It's free, so enjoy it!
Subjects:
Grades:
2nd - 4th
Types:
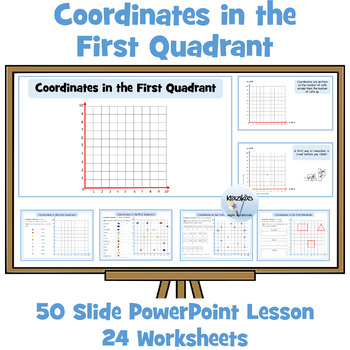
Coordinates in the First Quadrant
This bundle contains a PowerPoint lesson and a set of differentiated worksheets on coordinates in the first quadrant.PowerPoint LessonThis is a highly visual and interactive 50-slide PowerPoint lesson on coordinates in the first quadrant. The PowerPoint clearly explains and visually demonstrates the following:gridsx and y axesthe originhow to locate coordinateshow to plot coordinateshow to write coordinatesOpportunities are provided within the PowerPoint for students to locate and plot coordinat
Grades:
3rd - 7th
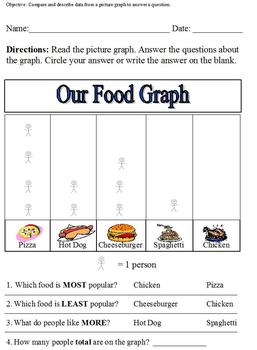
Food Picture Graph; Compare and Describe Data in a Graph
This is modified for sixth grade special ed, statistics. Students will read the graph and answer the questions. This can also be used in primary grades.
Subjects:
Grades:
1st - 6th
Types:
Showing 1-24 of 314 results


