64 results
3rd grade graphing homework for Microsoft Word
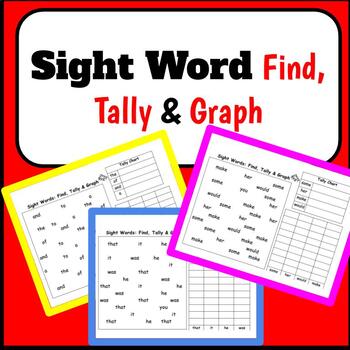
K-2 FRY Words Pack: Find-Tally-Graph for first 100 words
This is a packet of Fry sight words. It includes the first 100 and then some second 100 words. There are 4 words to practice on each page. Students have to find all of the words, tally how many of each word they found, and graph how many of each word. This allows for students to see the new sight words multiple times and it helps them learn the words. This packet correlates with my other pack of sight words that I created. This can be used for word work, morning work, or homework.
March Finished Work Packet - First Grade
I have created a March Themed Packet that is ideal for when children finish work early or a great packet for families to work on at home. This packet would be great for either first or second grade students. When making this packet I made sure to focus on the new first grade common core standards so that it would fit right into the curriculum. (Note that you can pick and choose which pages work great for your students once you have printed the product.)
Common Core Focuses:
Patterning Two Dig
Grades:
1st - 3rd
Types:
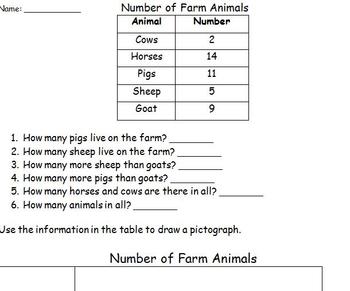
Create pictograph and Bar graph from a table
Simple practice to transfer data from a table to create a pictograph or a bar graph
clean and simple layout so as not to distract students
good to use for small group or individualized instruction
Subjects:
Grades:
2nd - 4th
Types:

Reading Log **EDITABLE**
A home reading log that allows students and parents and teachers to track student's reading efficiently. Allows for measurement, graphing and numeration practice at school. Simple enough for busy parents.
Subjects:
Grades:
K - 3rd
Types:
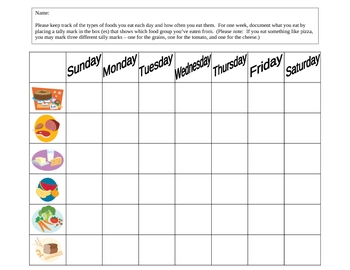
Food Group Tally
This worksheet is a wonderful assignment that gets children to develop an awareness of what they are eating each day. By the end of the week, they will be able to clearly see how often they eat from each of the food groups, which areas they need to eat more from and which areas they eat from a lot. Also, it's a great review or practice of using tally marks. After the initial assignment has been completed, other lessons can be done comparing the charts, graphing which food group the children a
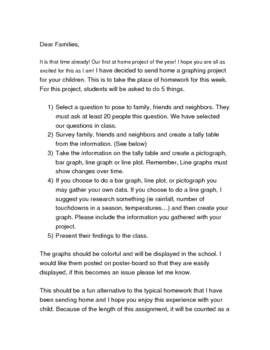
Student Graphing Project
This is a at home graphing project that I use with my fourth grade students. It covers line graphs, line plots, pictographs, and bar graphs. The students also create their own survey question and create a tally table to collect their data. Includes a rubric for scoring.
Subjects:
Grades:
3rd - 5th
Types:
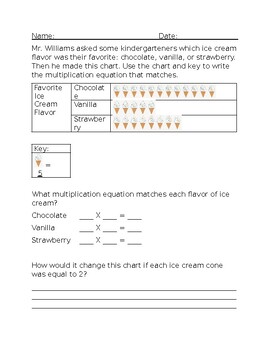
Multiplication Ice Cream
Students will use the chart to answer questions and write the corresponding multiplication equation
Subjects:
Grades:
2nd - 3rd
Types:
Also included in: Graphs/Multiplication Fall Bundle
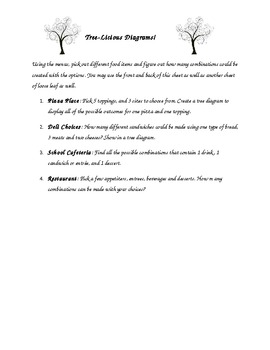
Tree Diagram Activity
You will need to supply three menus (I print mine from various neighborhood restaurants). In this activity, the students use various menus to pick and choose toppings and entrees and then create tree diagrams based on the criteria.
Subjects:
Grades:
3rd - 6th
Types:
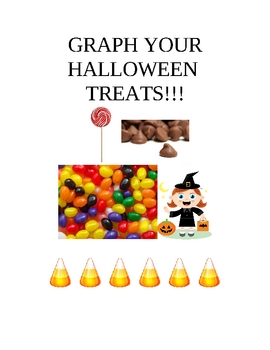
GRAPH YOUR HALLOWEEN TREATS
GRAPHING, SWEET GRAPHING !! After students have gone trick or treating, have them complete this fun activity which gives them graphing practice. Students must sort out treats and categorize them first. Next they have to complete a table which is provided and then the graph which is also provided in this activity packet. THIS SHOULD BE DONE AT HOME, but it can be a classroom assignment if you are allowed to give out candy at school.
Subjects:
Grades:
3rd - 6th
Types:
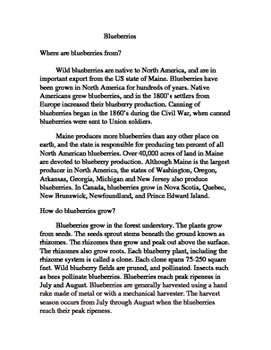
Nonfiction Reading and Graph Skills Practice
This packet includes a nonfiction reading on blueberries with open response questions, as well as two graphs that require students to read and interpret the graph and answer the questions that follow. Great math and ELA test prep.
Subjects:
Grades:
3rd - 5th
Types:
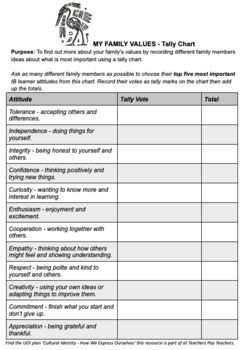
Tally Chart: My Family Values - Maths - Research - Social Studies
A data handling maths task based on the IB attitudes. Helps students learn more about their own identity and their family. It could be used for graphing. It can stand alone or be used as part of in the Cultural Identity - How We Express Ourselves PYP Enhanced unit available here on TpT.
Subjects:
Grades:
3rd - 6th
Also included in: Cultural Identity Inquiry Bundle - Social Studies - Planner - IB PYP
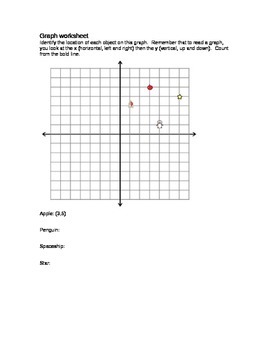
Scratch: Graph Worksheet
In order to fully understand the motion blocks in Scratch, students must be able to use a graph. This document is a short exercise where students will locate objects on a graph. This graph worksheet focuses on the positive coordinates.
Grades:
K - 3rd
Types:
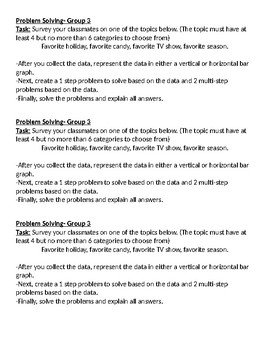
Bar Graph Differentiated Tasks
3rd Grade Bar Graph Tasks.
3 Differentiated Tasks.
Each task has a challenge.
Perfect for using during/at the end of GoMath Chapter 2.

Line Plot Project
This is a project in which students will have to apply their measuring skills to measure different flowers. They will then have to create a line plot to see which flower height is the most common. This is a real-life application project that challenges students to apply what they know in a new way to see if they can transfer their knowledge. Great graphing and measuring task!
Subjects:
Grades:
1st - 4th
Types:
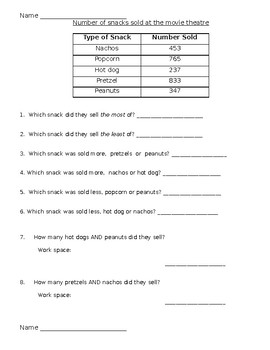
4 worksheets- comparing and reading a table
Students use the table at the top of the page to answer questions about more/less or combining items from the table. This includes 4 different pages meant for 4 different worksheets.
Grades:
2nd - 4th
Types:

Line Plot Practice
This is a worksheet designed to be used after teaching line plots. The students are given a data, asked to make a line plot and then answer questions related to the line plot.
Grades:
2nd - 5th
Types:
Math Problem Solving Skills
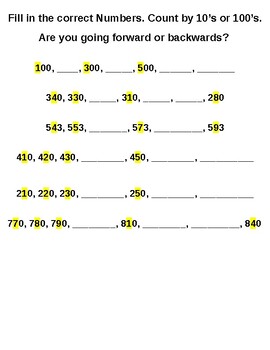
This math problem solving packet includes skill practice on:1. Counting Forward and Backward (by 10's and 100's)2. Calendar Reading (day, month, week, year)3. Graph Reading (most/least)4. Counting Tally Marks5. Counting Money with Touchpoints6. Fractions7. Measurement8. Adding Fractions9. Ordering Fractions10. Telling Time11. Greater Than/Less Than12. Measuring Tools13. Shapes (number of sides/corners)14. Repeated Addition15. Making Equal Groups16. Number Sequencing17. Three-Digit Subtraction18.
Subjects:
Grades:
1st - 3rd
Types:
Stem and Leaf Plot Data Quiz
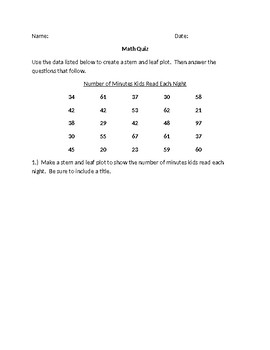
A quiz where students organize data in a stem and leaf plot and then uses the data to answer questions about maximum, minimum, mode, range, median.
Subjects:
Grades:
3rd - 6th
Types:
Weekly Reading Report Line Graph
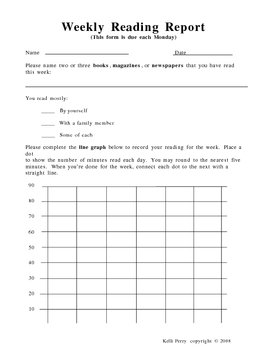
This free product works as a daily and weekly log for students to report their at-home reading. Rather than simply listing their minutes for each day, students graph them, then add them together at the end of the week. This form is set up for students to take the form home on Monday and return it the following Monday, but it's easily adaptable to fit your schedule. You can also make multiple copies for each student and compile them into a notebook. A different version of this form, geared to sl
Subjects:
Grades:
3rd - 6th
Types:
Color Me ( Pie)
I have made a PIe chart that is easy for any ages to use. it has room for ten results. these can be from rolling dice, spinning a wheel, or picking out of a hat. We have used it in preschool to using a color side die. In preschool, we are just working on graphing so they don't need it for percentages but other grades could use it for percentages.
Grades:
PreK - 12th
Types:
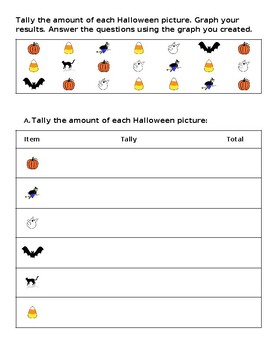
Halloween Graphing
Count the Halloween pictures and graph the results. Students then answer computation questions based on the graph.
Subjects:
Grades:
PreK - 5th
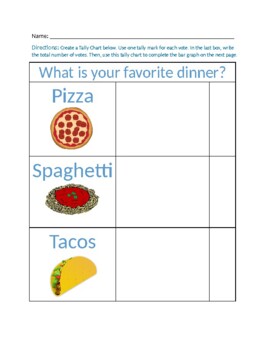
1st Grade Data, Tally Chart and Bar Graph
This is graph work that I use for either classwork or homework. Students are able to ask the question to their classmates or their family and complete the tally chart as well as the bar graph.
Grades:
K - 4th
Types:
CCSS:
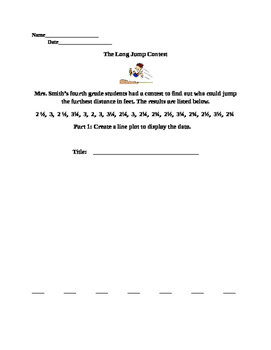
Creating a Line Plot - Data Analysis Activity
Students will use data to create and interpret a line plot. This activity requires students to create a scale based on fractions as aligned to the fourth grade common core standards.
Subjects:
Grades:
3rd - 4th
Types:
CCSS:
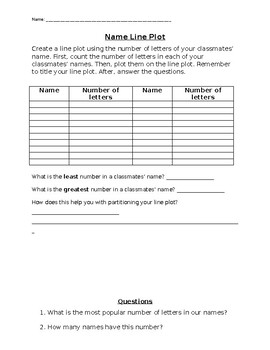
Line Plots with classmates' names
Have your students create a line plot with their classmates' names. Just type (or write) in your class list and copy!
Subjects:
Grades:
2nd - 5th
Types:
Showing 1-24 of 64 results


