70 results
3rd grade graphing worksheets for Easel Activities
![Preview of 3rd Grade End of the Year Math Review [[NO PREP!]] Packet](https://ecdn.teacherspayteachers.com/thumbitem/3rd-Grade-End-of-the-Year-Math-Review-NO-PREP-Packet-2470853-1714741123/original-2470853-1.jpg)
3rd Grade End of the Year Math Review [[NO PREP!]] Packet
End of the year 3rd Grade Math Packet - Great for finishing 3rd grade math concepts, summer review or beginning of the year 4th grade concepts as a review.A perfect resource for ending the school year, home schooling or your summer school needs!UPDATED TO INCLUDE DIGITAL for your distance learning needsMath review packet includes 22 pages of math practice directly aligned to third grade common core standards. Includes the following:Multiplication/Division3-digit addition addition/subtractionTime
Subjects:
Grades:
3rd
Types:
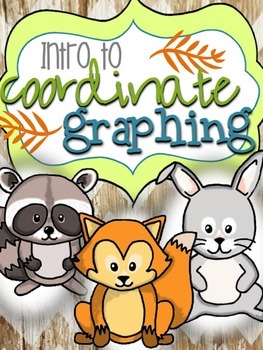
Coordinate Graphing Ordered Pairs Activities - Printable or Google Classroom
Activities and mystery pictures to teach coordinate graphing and ordered pairs so kids can plot points and solve problems on a coordinate plane. Teach your students about graphing in the first quadrant of the coordinate plant with these woodland animal themed pages!**Easy to use for distance learning!** Digital layer already added - Assign in Google classroom with the TpT digital activity tool and kids can draw lines with the pen and enter answers in text boxes.Contents:*Coordinate Plane Vocab A
Grades:
3rd - 5th
Types:
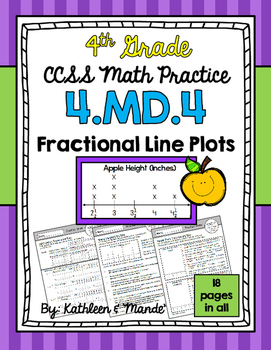
4.MD.4 Practice Sheets: Fractional Line Plots
This 4.MD.4 CCSS aligned packet includes 18 practice sheets to teach/reinforce line plots with whole numbers, fractions, and mixed numbers. These sheets can be used to introduce a concept, review a concept, or send home as reinforcement for homework. **An answer key is provided.- - - - - - - - - - - - - - - - - - - - - - - - - - - - - - - - - - - - - - - - - - - - - - - - - - - - - - - - - - - - - - - - - - -This resource can be used along with our other 4.MD.4 resources:4.MD.4 Task Cards: Set 1
Subjects:
Grades:
3rd - 5th
Types:
Also included in: 4.MD.4 BUNDLE: Fractional Line Plots
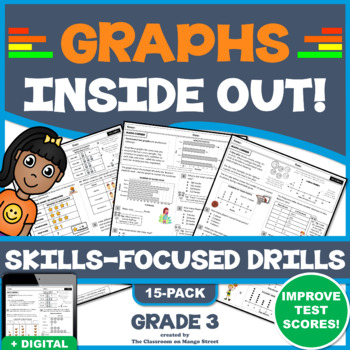
3RD GRADE GRAPHS: BAR, PICTURE, & LINE PLOTS - 15 Skills-Boosting Worksheets
Students will complete word problems related to bar graphs, pictographs, line/dot plots and tally charts. This includes reading and interpreting data, performing calculations, matching data to and representing data in graphs. Use these scaffolded math drills to teach and reinforce the fundamentals, or prep for test day. Each drill begins with a mini-lesson followed by several Common Core designed, simulated test questions (including multi-part & open response). These practice worksheets
Subjects:
Grades:
3rd - 4th
Types:
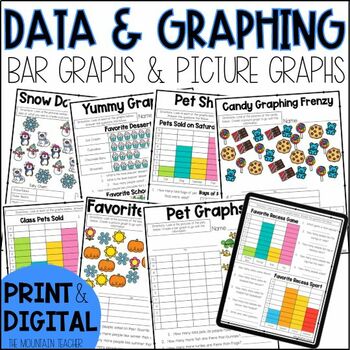
Bar Graphs and Picture Graphs Graphing Worksheets for 2nd Grade
Teach bar graphs and picture graphs to your 2nd or 3rd graders with ease using these graphing worksheets and assessments. This 3 week unit is filled with printable and digital graphing worksheets, assessments and activities covering various types of word problems about different graphs.Students will practice collecting data, graphing data on bar graphs and picture graphs and answering questions about the data using the graphs. Students will practice using graph keys on both picture graphs and ba
Subjects:
Grades:
1st - 3rd
Types:
CCSS:
Also included in: 2nd Grade Math Worksheets and Lessons YEAR BUNDLE Print and Digital
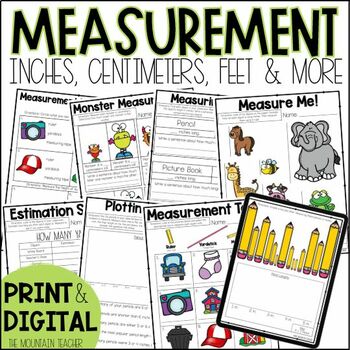
Measurement Worksheets, Anchor Charts & Assessments for 2nd Grade
Need some helpful measurement worksheets and anchor charts for your 2nd grade students? This 2 week unit is filled with printable and digital measurement worksheets, assessments and hands-on activities covering using a ruler, inches, centimeters, comparing lengths, length, width, height, estimating, line plots, selecting the correct tool, and more.What's Included in the Measurement Worksheets:23 Page Digital Workbook (9 Printable Worksheets PDF)Digital/Printable Pre and Post TestTeaching GuideAn
Subjects:
Grades:
1st - 3rd
Types:
Also included in: 2nd Grade Math Worksheets and Lessons YEAR BUNDLE Print and Digital
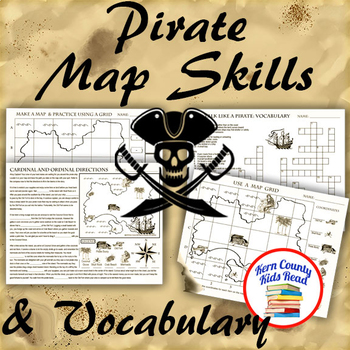
Pirate Map Skills: Grid Coordinates, Cardinal & Ordinal Directions, Symbols
Teach and strengthen coordinate grid math, geography mapping skills like map symbols and cardinal and ordinal directions with a compass rose, and new vocabulary with these pirate themed printable worksheets. These are fun mini-lesson activities for Talk Like A Pirate Day on September 19th or if you have a pirates themed unit. Cardinal directions and coordinate grid mapping are important introductory skills to mastering latitude and longitude map skills and being able to use an atlas. Coordinate
Subjects:
Grades:
3rd - 6th
Also included in: Pirates Thematic Unit Study Bundle: Talk Like A Pirate Pack!
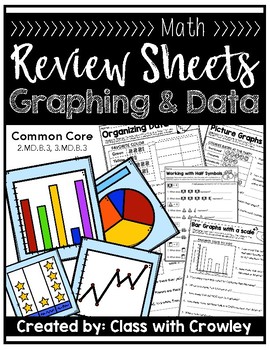
Graphing and Data (Review Sheets)
Easy... no prep... 37 Different review sheets to practice reading and interpreting graphing and data. Collecting data of your ownLabeling different tables, graphs and chartsFrequency Tables•Organizing data from a tally chart into a frequency table•Using a frequency table to answer one step questions•Using a frequency table to answer multi-step questions•Reading and interpreting multi-column frequency tablesPicture Graphs•Reading a picture graph w/no scale•Reading a picture graph w/ a scale•Using
Grades:
2nd - 4th
Types:
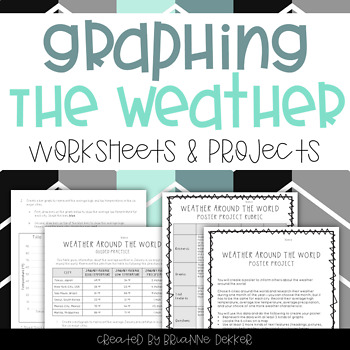
Graphing the Weather - Worksheets and Projects
This product contains science and math graphing worksheets and projects for a unit on weather. These resources were created with NGSS content and evidence statements in mind.
The first set of worksheets focus on weather around the world, and the second set focus on weather patterns in one area. Each set contains guided practice, in which students are given data and asked to create different types of graphs to represent the data; independent practice, in which students must gather data and then
Subjects:
Grades:
3rd - 5th
Types:
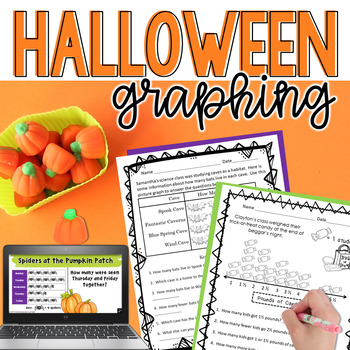
Halloween Graphing- Digital AND Printable Math Activities
Students will love creating and interpreting their own bar graphs, pictographs (picture graphs), and line plots with fractions on a number line! Printable worksheets, Digital Google Slides, and TpT Easel versions are all included in this fun Halloween Math Activity!Quickly print the Halloween math worksheets for centers, homework, morning work, bell ringers, or emergency sub plans. Or easily assign in Google Classroom or TpT Easel! Perfect for the whole month of October!Topics include Halloween
Subjects:
Grades:
3rd - 5th
Types:
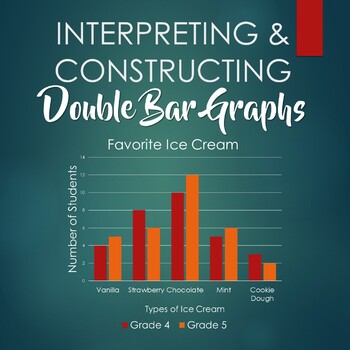
Interpreting and Constructing Double Bar Graphs - Booklet
This booklet includes six worksheets:- 3 double bar graphs for students to interpret- 3 sets of data for students to construct double bar graphs, with corresponding questions- answer key
Subjects:
Grades:
3rd - 6th
Types:
Third Grade Probability and Graphing Review
Now aligns to the new 2016 VA SOLs. This product is a 5 page practice packet/mixed review that aligns to 3rd grade VA Math SOLs. It covers all the SOLs in the 3rd grade Probability/Statistics Strand, including the following math topics:-Collecting Data-Organizing Data-Representing Data-Interpreting Data-Bar Graphs-Picture Graphs-Probability-CombinationsAn answer key is included for each page. This product can be used as whole group practice, small group practice, independent practice, remediatio
Subjects:
Grades:
2nd - 4th
Types:
Also included in: Third Grade Math SOL Review Bundle
Represent and Interpret Data Worksheets
I created these four worksheets to go along with my Grade 3 GoMath curriculum, Chapter 2. This product includes a worksheet each on bar graphs, picture graphs, and line plots, and a project for creating picture graphs. Students will practice using and making tally tables, frequency tables, graphs, and line plots, as well as answer questions based on the data.
Answer keys are included for all worksheets.
*This product is included in my Math Worksheets Bundle. Click here for more information!*
Subjects:
Grades:
2nd - 4th
Types:
Also included in: Math Worksheets Bundle
Graphing Templates: Tally Chart, Bar Graph, and Pictograph
Use these graphing templates to create a tally chart, bar graph, and pictograph. Students will be so excited to choose a topic, complete a survey, and record their data on these graphs. Each activity comes in color and black and white. The color copy is great to project on the board to do a class example first.Digital Learning:Includes a digital version using the TPT Digital Activity Tool. Text boxes have already been inserted so students can easily type their responses. You can also edit the
Grades:
1st - 3rd
Types:
Also included in: Graphing Worksheets: Tally Chart, Bar Graph, and Pictograph
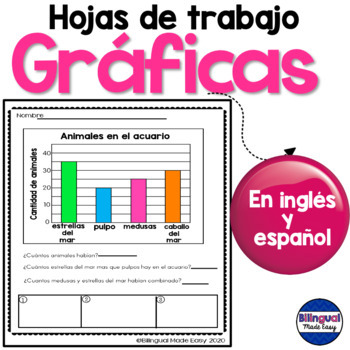
Hojas de trabajo de matemáticas: Graficas en inglés y español
USE AS A DIGITAL PRODUCT OR PRINT THE PDFThis Bilingual Graphing Unit (English/Spanish) for second and third graders includes 10 different types of graphing worksheets to master this mathematical skill. Graphs are also included in color for a teacher to model. Each graph worksheet was created in English and has an identical worksheet in Spanish. This unit was designed to be used with English Language Learners in a Bilingual, English as a Second Language or Dual Language c
Subjects:
Grades:
2nd - 3rd
Types:
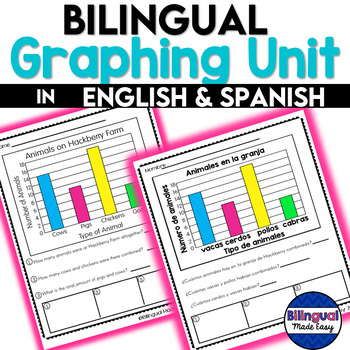
Graphing Worksheets in English & Spanish DIGITAL LEARNING
This Bilingual (English & Spanish) Graphing Unit for second and third grade students includes 10 different types of graphing worksheets.Each worksheet is available in black and white or in color for teachers to model. Each graph worksheet was created in English and has an identical worksheet in Spanish. This unit was designed to be used with English Language Learners in a Bilingual, English as a Second Language or Dual Language classroom. You no longer need to translate your worksheets or br
Subjects:
Grades:
2nd - 3rd
Types:
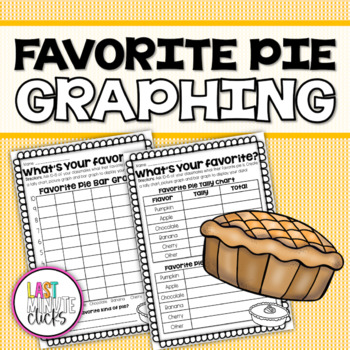
Favorite Pie Graphing Activity - Tally Chart, Picture Graph and Bar Graph
Favorite Pie Graphing Activity - Tally Chart, Picture Graph and Bar GraphThis Favorite Pie Graphing Activity will keep your students engaged and excited about graphing data! First, students will go around the classroom and survey their classmates by asking the question: "What is your favorite kind of pie?" Students will tally up the data on a tally chart. Then, students will record their findings and data on a picture graph and bar graph! Students will love learning about and relating to other s
Subjects:
Grades:
1st - 4th
Types:
CCSS:
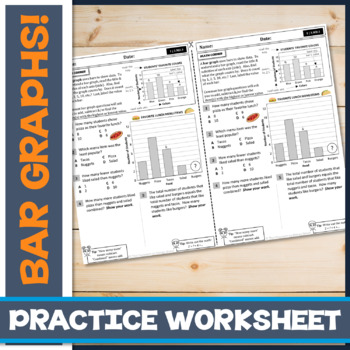
Interpreting Bar Graphs to Solve Word Problems: Exit Slip/Ticket
This is a quick, scaffolded drill on interpreting bar graph data to solve single and multi-step math problems. Use as guided and independent practice, or assign as homework/an exit slip to assess student mastery. This drill has a mini-lesson at the top, followed by 5 questions and originally comes from a larger unit designed to teach third graders Graphs Inside Out!This drill is a half-page, with two of the same activities fitted per page to save on printing. BOOST YOUR MATH TOOLKIT! Bar G
Subjects:
Grades:
3rd - 4th
Types:
CCSS:
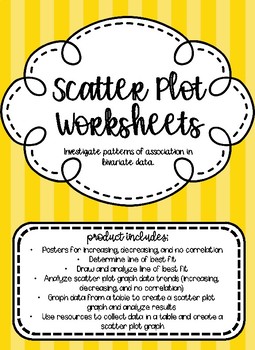
Scatter Plot Graph Worksheets
A collection of worksheets to use when teaching how to investigate patterns of association in bivariate data. Product includes 3 posters for students to reference how to determine if data is increasing, decreasing, or has no correlation. Types of worksheets include:
-Determine line of best fit
-Draw and analyze line of best fit
-Analyze scatter plot graph data trends (increasing, decreasing, and no correlation)
-Graph data from a table to create a scatter plot graph and analyze results
-Use reso
Subjects:
Grades:
1st - 12th
Types:
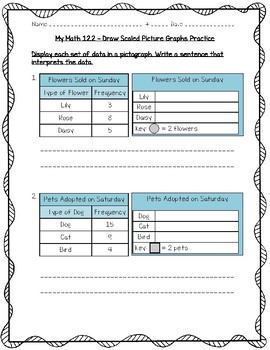
My Math - 3rd Grade - Chapter 12 - Represent and Interpret Data Worksheets
What's Included
Included in this pack are 8 worksheets on all the lessons in the third grade My Math book for Chapter 12.
These can be used as a quiz, formative assessment, homework, or just extra practice!
Answer keys are included for each worksheet.
Lesson 1: Collect and Record Data
Lesson 2: Draw Scaled Picture Graphs
Lesson 3: Draw Scaled Bar Graphs
Lesson 4: Relate Bar Graphs to Scaled Picture Graphs
Lesson 5: Draw and Analyze Line Plots
Lesson 6: Hands On: Measure to Halves and Fou
Subjects:
Grades:
3rd
Types:
Also included in: My Math 3rd Grade Worksheets - Entire Year Bundle
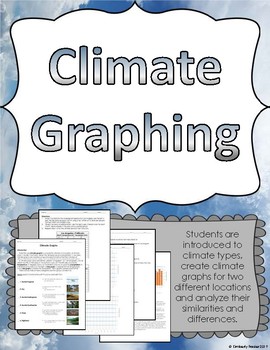
Climate Graphing Activity
Help students understand the basics of climate through this graphing activity. Not only does this address the science standards, it also integrates math and data analysis.Included in this printable graphing activity:-Introduction to what climate graphs are-Descriptions of 6 major types of climates-Directions for how to make a climate graph-Climate graph set ups-Data for two locations: New York City and Los Angeles-Analysis questions comparing the two climate graphs (use of CER)-Set of climate gr
Subjects:
Grades:
3rd - 9th
Types:
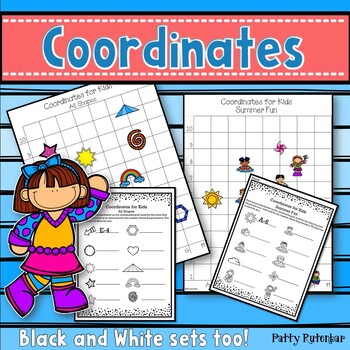
Coordinates for Kids Quick and Easy (Color and BW)
Coordinates are a set of values that show an exact position. The pictures are placed on a point on the chart. Students will line up the point between the horizontal and vertical lines to see where specifically where the picture is sitting.This set of 12 different maps or charts will help your young students find the exact position of the pictures. They will use coordinate skills to locate and identify the location. This set was updated in July 2022. It now includes a black and white version of
Subjects:
Grades:
1st - 3rd
Types:
CCSS:
M & M Graphing for Any Time of Year with Easel Activity
Sometimes it is fun to do M & M's counting and graphing at different times of the year on birthdays, holidays, or as a treat. It can be a great experiment to see if results change depending on the time of year, too. Try it at Halloween, then repeat for Thanksgiving, Christmas, Valentine's, St. Patrick's Day and Easter. Compare the results. Students love it! Has teacher directions, two M & M's sorting mats in color or black and white, a tally sheet with questions, a bar graph worksheet, a
Grades:
K - 3rd
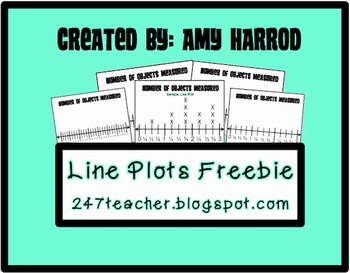
Line Plot Freebie
In this freebie you will find one line plot sample, one blank line plot, and measurement line plots. This product was specifically designed for grade 3 however can be used for other grades. Please do not rate this product low or leave unkind feedback as it is free.Domain: Measurement and Data (MD)Cluster: Represent and interpret data.Standard: 3.MD.4. Generate measurement data by measuring lengths using rulers marked with halves and fourths of an inch. Show the data by making a line plot, where
Subjects:
Grades:
3rd
Types:
Showing 1-24 of 70 results


