
Mean Median Mode Range Measures of Central Tendency Data Task Cards


- PDF
- Easel Activity
What educators are saying
Also included in
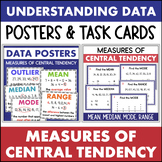 This math bundle includes two resources to help you teach data and measures of central tendency. DATA POSTERSIncludes 6 clear, simple anchor charts that include a definition and example. Bold fonts make them easy to see from across the room.Includes the following measures of central tendency:meanmedPrice $4.00Original Price $5.00Save $1.00
Description
These data task cards are a great way for students to practice analyzing data to find the mean, median, mode, and range!
There are several types of questions, all addressing measures of central tendency. Some require students to interpret a data set of whole numbers. Others involve data presented in a line plot. The last type of question requires the student to choose the correct method for finding the mean, median, mode, or range.
This math resource includes:
- 16 task cards
- recording sheet
- answer key
- digital version
These task cards are provided in 2 sizes:
- 1/4 page - For individual student use or small groups
- Full page - For whole group instruction, display on your interactive whiteboard, walk the room activity, etc.
My favorite activity with task cards is to hang them around the room and let students go on a "math walk" with a clipboard and pencil. As they move through the room, they stop at any card they find and solve.
DIGITAL ACTIVITY
These data task cards include a digital version in Easel. There is one problem per page with self-checking answers. You can assign specific questions or the entire set at once.
YOU MIGHT ALSO LIKE
If your students need visual support, check out:
