1,190 results
7th grade graphing homework pdfs
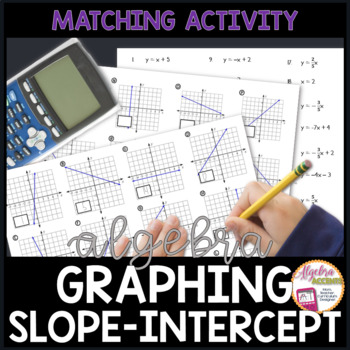
Graphing Linear Equations in Slope Intercept Form Matching Activity
Students will identify the slope-intercept form linear equation with its graph in this 24 problem matching activity. Excellent for reinforcing slope and y-intercept. This activity can also be used to complement a lesson implementing the use of the graphing calculator. Answer Key is provided.CLICK HERE to view a listing of all the LINEAR FUNCTIONS Resources in my store. ____________________________________________________SIGN UP for my newsletter and receive a surprise freebie!_________________
Grades:
7th - 10th
Types:
Also included in: BACK TO SCHOOL | ALGEBRA 1 LINEAR EQUATIONS | FUNCTIONS Bundle
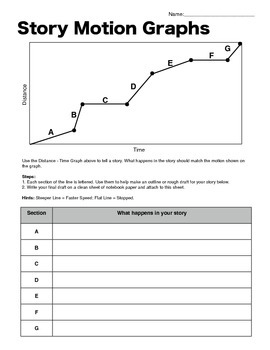
Story Motion Graphs - Distance-Time Graph Writing Activity
This writing activity will allow you to see how well students can interpret a distance-time graph, and let them use their imaginations as well.
Each section of the graph is labeled with a letter. In the table below, students can create an outline for their story that matches the motion graphed above. Then, they can write their final draft on a clean sheet. Even better: there is an advanced version for your higher-level thinkers. They must label the axis with units that match their story.
The
Grades:
5th - 8th
Types:
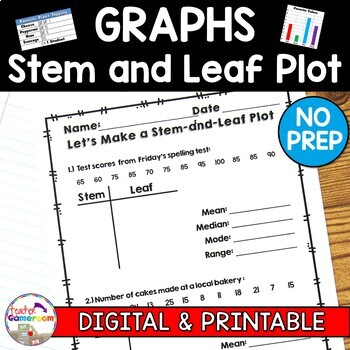
Making a Stem and Leaf Plot with Mean, Mode, Median, Range Worksheets
These worksheets allows students to make a stem and leaf plot using a given set of data. Student must build the plots on their own and then must find the mean, median, mode, and range of the data. There are 4 worksheets, each with 2 Stem and Leaf graphs to be made. Great for review or as a homework assignment. Full Page answer keys included. Extra licenses are $0.75.Questions/Materials include:✔️ 2 Questions per page✔️ 4 Worksheets✔️ 10 - 12 Numbers per graph✔️ 2-Digit and 3-Digit Numbers✔️ Rea
Grades:
4th - 8th
Types:
CCSS:
Also included in: Graphs Bundle | No Prep Digital Resources
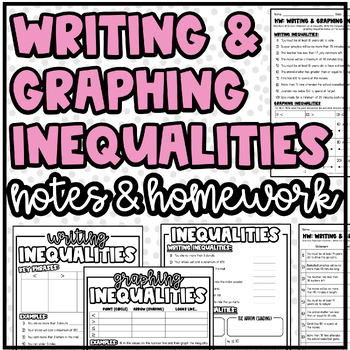
Writing & Graphing Inequalities | Notes & Homework or Practice
Writing & Graphing Inequalities Notes & Homework:This resource includes notes pages and homework/practice that goes along with the notes! It's organized, clean, and ready to go! All you need to do is print! :) Make sure you check the previews for a visual! Includes:Notes: Writing InequalitiesNotes: Graphing InequalitiesNotes: Writing & Graphing Inequalities (this is a combined notes page of the two above - same problems - just merged onto one page)Homework: Writing & Graphing Ine
Grades:
5th - 7th
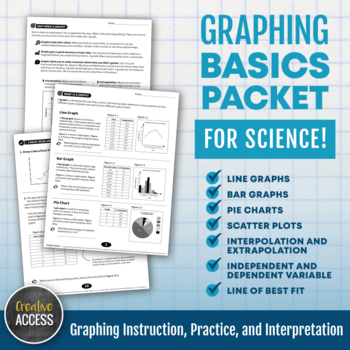
Science Graphing Basics Packet: Line Graph, Bar Graph, Pie Chart, Scatter Plot
This no-prep 10-page packet provides graphing instruction, practice, and interpretation for your middle and high school science students. Topics include line graphs, bar graphs, pie charts, scatter plots, extrapolation/interpolation, line of best fit, graphing labels, and independent/dependent variables.Each page is packed with information, graphs, examples, and frequent check-your-understanding questions. Choose to complete the packet as a whole class, in stations, in groups/partners, or as an
Subjects:
Grades:
7th - 12th
Also included in: Mega Bundle of No-Prep and Low-Prep Secondary Science Sub Plans
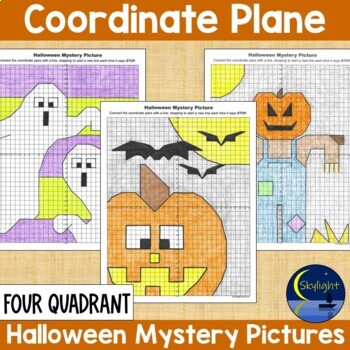
Halloween Four Quadrant Coordinate Plane Graphing Pictures
These Halloween coordinate plane graphing pictures are a great activity for your math lessons, early finishers, when there is a substitute, or just for an extra fun activity for the class during October. Coordinate plane mystery pictures are a fun way for students to practice graphing. They just graph the coordinate pairs in order, connecting the points with a line until it tells them to stop the line they are working on and start a new one. When they are finished they have a fun picture to colo
Subjects:
Grades:
6th - 8th
Types:
Also included in: BIG BUNDLE of Holiday Coordinate Plane Graphing Pictures Four Quadrant
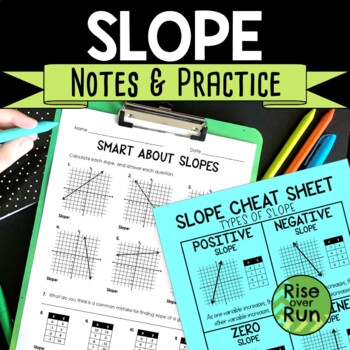
Slope Notes and Practice Worksheets
Help students identify types of slope and how to calculate slope with these notes sheets and practice problems. Included: Slope Cheat Sheets/Guided Notes These pages help students identify positive, negative, zero, and undefined slope as well as calculate slope from graphs, tables, and two given points. The sheets are included as cheat sheets with all the information filled in and as guided notes with blanks for students to fill in.Practice Sheets Three worksheet pages are included for extra pra
Grades:
7th - 9th
Types:
Also included in: 8th Grade Math Activities & Lessons Bundle for the Whole Year
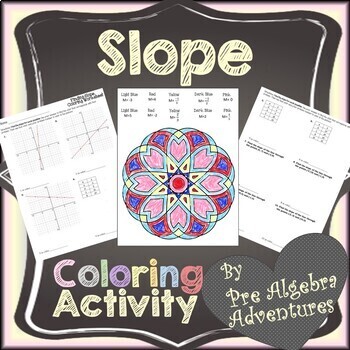
Finding Slope from Table, Graph and Two Points Coloring Activity - No Prep! Fun!
Finding Slope from Table, Graph and Two Points Coloring Activity!This is a super fun no prep worksheet activity. Your students will stay engaging while finding slopes. Students will solve for the slope in 10 problems and then use their answers and the problem number to find the corresponding color from the key on the coloring page. They'll use that color and the problem number to color in the shape. *Answer key included!*************************************************************************Ch
Grades:
6th - 10th
Types:
Also included in: Finding Slope From Table, Graph, 2 Points {Slope Activity}
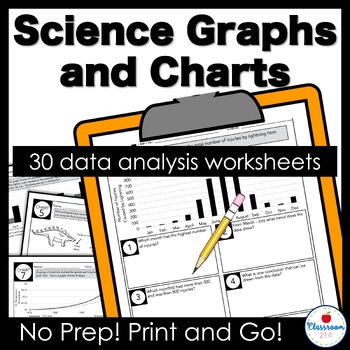
Middle School Data Analysis Reading Graphs Worksheets
Reading graphs and interpreting data is challenging. Teach your science students to master comprehending and analyzing charts, graphs, and diagrams in just a few minutes a day! This mega pack gives students a graph or chart and five questions to help them read and analyze it.***This is the print version.***Click here to see the print and digital bundle with four FREE bonus charts!If your students are like mine, they collected data well during a scientific investigation, but struggle to underst
Subjects:
Grades:
4th - 8th
Types:
NGSS:
MS-LS4-3
, MS-LS4-1
, MS-ETS1-4
, MS-LS2-1
, MS-ETS1-3
Also included in: Middle School Science Graphs Worksheets Print and Digital Bundle
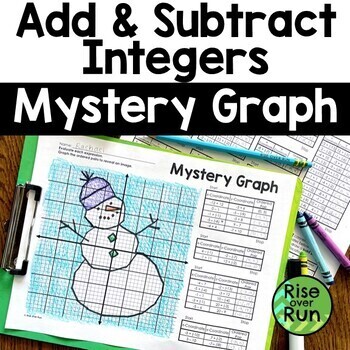
Winter Coordinate Graphing Picture Adding & Subtracting Integers
This coordinate graphing picture is a fun way to practice operating with positive and negative numbers. It's the perfect winter math activity for middle school (or even review in high school)!Students love mystery graphs… but this one has a twist! Here's how it works: First, students must add and subtract integers to reveal their ordered pairs.Then, they graph the ordered pairs on a coordinate plane and the image of a snowman appears.Coloring is optional, and these make great classroom decoratio
Subjects:
Grades:
7th - 8th
Types:
Also included in: 7th Grade Math Winter Activities for December, January, & February
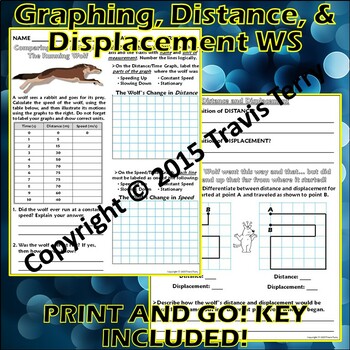
Worksheet: Graphing, Distance, and Displacement w/ The Running Wolf
Please Read: When calculating the speeds, it is not the average speeds... it is the instantaneous speeds of the wolf. For an explanation of instantaneous speed, watch this video: http://bit.ly/1J7LAUPThis worksheet uses a Running Wolf to help students to visualize its movements as it hunts. Students will calculate the wolf's speed as it runs, and then put those calculations into a data table, Students can then graph the wolf's motion on a distance-time graph and a speed-time graph (instantaneou
Grades:
6th - 9th
Types:
Also included in: Bundle: Super Speed Power Pack

Graphing Exponential Functions ALGEBRA Worksheet
Graphing Exponential Functions
12 problems with a table and graph for students to use. Fits on two pages. Answer Key included.
RELATED PRODUCTS:
Exponential Functions BUNDLE (Contains this product)
Exponential Functions ALGEBRA Worksheet
Exponential Functions ALGEBRA Skills Check
Graphing Exponential Functions Practice
Graphing Exponential Functions Practice #2
An exploration of Exponential functions
Compound Interest Review + Practice
Exponential Growth and Decay Review + Practice
Ex
Subjects:
Grades:
6th - 12th
Types:
Also included in: Exponential Functions ALGEBRA Bundle

Data Analysis and Graphing Worksheet Scientific Method Practice (Herons)
Students build GRAPHING and DATA ANALYSIS skills. This activity provides a data table and an incomplete bar graph related to nesting habits of herons. Students follow directions that lead them through foundational graphing and data analysis skills. Instruction is built into the worksheet. This activity builds the following skills:Setting up bar graphs, including choosing intervals, labeling axes, and writing graph titles.Using data to make a bar graph (with an example already in place).Pulling
Subjects:
Grades:
6th - 9th
CCSS:
NGSS:
MS-LS2-2
, MS-LS2-1
, HS-LS2-1
, HS-LS2-2
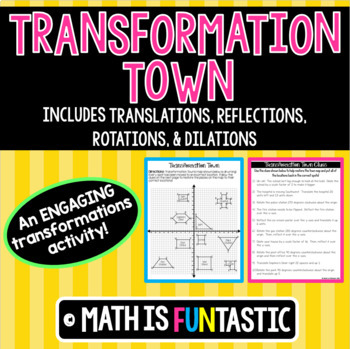
Transformations Town (Translations, Reflections, Rotations, & Dilations)
This print and ready to use product is designed to be a culminating activity on transformations. Skip the normal worksheets and assessments and use this activity allows students to demonstrate their understanding in a more engaging, fun way! Students will be given 10 “town” shapes on a map of "Transformation Town" and will need to follow ten clues to transform the locations into their correct spots on the map.Students need to have an understanding of translations, reflections (both x and y-axis)
Grades:
7th - 10th
Types:
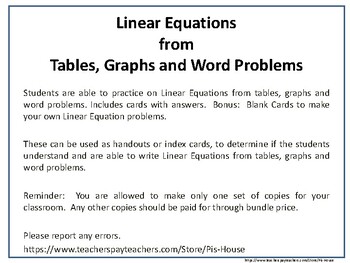
Writing Linear Equations - Find Slope from Tables, Graphs and Word Problems
Slope Cards, Handouts or ReviewThis worksheet helps students find slope problems from tables, graphs or word problems and allows the students to see all parts of writing linear equations.Includes:-Word Problems (slope)-Graphing Linear Equations-Table (slope)Can be used for: classroom assignments, homework, center material, prep material and review.Students or Teachers can also develop their own with blank cards, handouts.You can also purchase the following that are part of slope and y-intecept
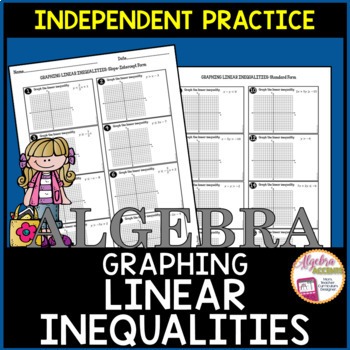
Graphing Linear Inequalities Practice
Graphing Linear Inequalities Practice Worksheet (16 problems)8 problems: Given a linear inequality written in slope-intercept form, students will identify the slope and y-intercept and graph the inequality.8 problems: Given a linear inequality written in standard form, students will write the inequality in slope-intercept form, identify the slope and y-intercept and then graph the inequality. Excellent resource to use as independent practice or homework. Answer Key provided._____________________
Subjects:
Grades:
7th - 11th
Types:
Also included in: ENTIRE STORE Middle School Math & Algebra 1 Activities BUNDLE
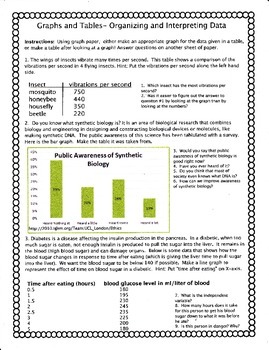
Graphs and Tables: Organizing and Interpreting Data
The NGSS standards require that students understand data in charts and graphs. This worksheet gives students some much needed practice on making and interpreting 3 different kinds of graphs and tables: line, bar and pie. I use this in my Biology classes, but it could be used in math and other science classes too. Student sample is included.
Subjects:
Grades:
7th - 12th
Types:
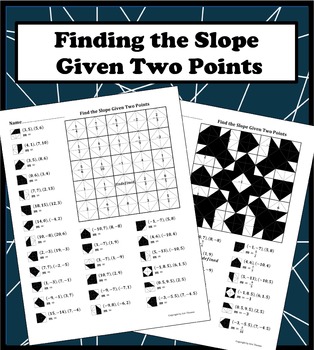
Finding the Slope Given Two Points Color Worksheet
25 unique problems on finding the slope given two points. Each question corresponds to a matching answer that gets colored in to form a symmetrical design. Not only does this make it fun and rewarding for students but it also makes it easy for students and teachers to know if the worksheet has been completed correctly. Great for classwork, homework, additional practice, extra credit, and subs. The designs can also be cut out and quilted together to make a great art piece. The pdf file contains t
Grades:
6th - 10th
Types:
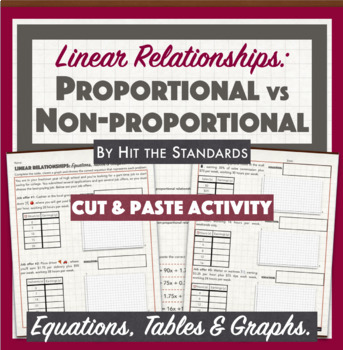
Proportional & Non-proportional Linear Relationships: Equations Tables Graphs
In this cut&paste activity, students must choose the best-paying job out of 5 given options. Each job salary represents a linear relationship, so students must complete a table, create a graph that represents each of them. Also, they must choose the correct equation (cut & paste) that represents each linear relationship. Finally, students must identify the relations as proportional or non-proportional. Hits CC Standards 7.RP.A.2, 8.EE.B.5, 8.F.B.4 & 8.F.B.5 Hits TEKS 8.4B, 8.5A, 8.5
Subjects:
Grades:
7th - 9th
Types:
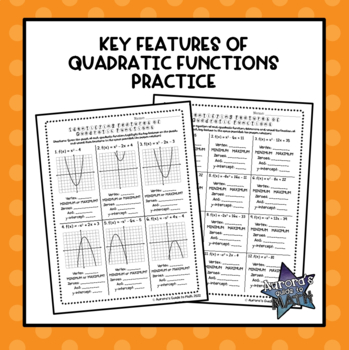
Key Features of Quadratic Functions
Key Features of Quadratic FunctionsThis no-prep resource is a great way to get students to practice identifying the key features of quadratic functions! This resource contains four pages of practice for a total of 28 practice problems! Each of the first three pages focus on a different representation of a quadratic (a page of graphs, a page of tables, and a page of equations). The fourth page contains multiple choice questions for test prep practice. This is a great way for students to practice
Subjects:
Grades:
6th - 12th
Types:
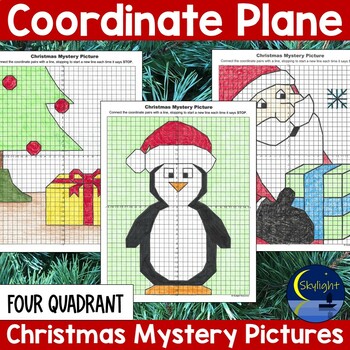
Christmas Coordinate Plane Mystery Graphing Pictures Four Quadrant Math
These Christmas coordinate plane graphing pictures are a great activity for your math lessons, early finishers, when there is a substitute, or just for an extra fun activity for the class during December. Coordinate plane mystery pictures are a fun way for students to practice graphing. They just graph the coordinate pairs in order, connecting the points with a line until it tells them to stop and start a new line. When they are finished they have a fun picture to color. These mystery pictures a
Subjects:
Grades:
6th - 8th
Types:
Also included in: BIG BUNDLE of Holiday Coordinate Plane Graphing Pictures Four Quadrant
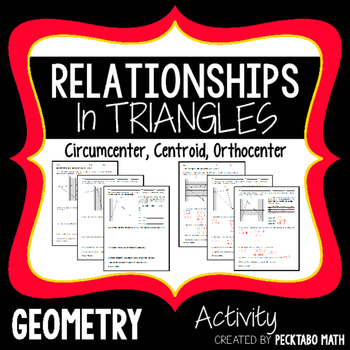
Relationships In Triangles Activity GEOMETRY Circumcenter, Centroid, Orthocenter
This activity has the students find the circumcenter, centroid, and orthocenter of a triangle Algebraically and then compare to the graph. Most problems do not have a lattice point as the answer which forces the students to use algebra to solve. It is a guided activity.
There are 4 versions of this activity. Each version has 3 pages. One page for each center.
The answer keys are detailed with the work for solving the systems.
*******************************************************************
Grades:
7th - 12th
Types:
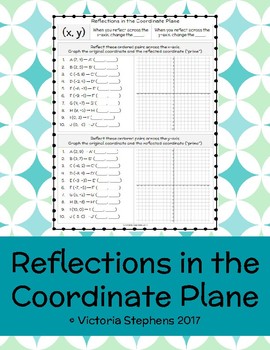
Reflections in the Coordinate Plane Practice
Students will practice plotting coordinates and reflecting them across the x-axis or the y-axis. Students will reflect 10 coordinates across the x-axis and 10 coordinates across the y-axis.
Grades:
6th - 8th
Types:
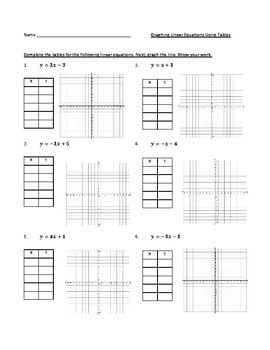
Graphing Linear Equations/Functions Using Tables (or XY Charts) Worksheet
I use this with my Algebra 1 students to practice creating their own tables and graphing the points. The students are good at filling in tables when the x value is given to them, but having a blank table is more challenging for them. The worksheet starts with all equations in slope-intercept form, then moves to standard form (a little bit more difficult for the students to visualize and complete). The worksheet then ends with slope-intercepts equations again but with rational coefficients. I tea
Showing 1-24 of 1,190 results


